Fig. 4.
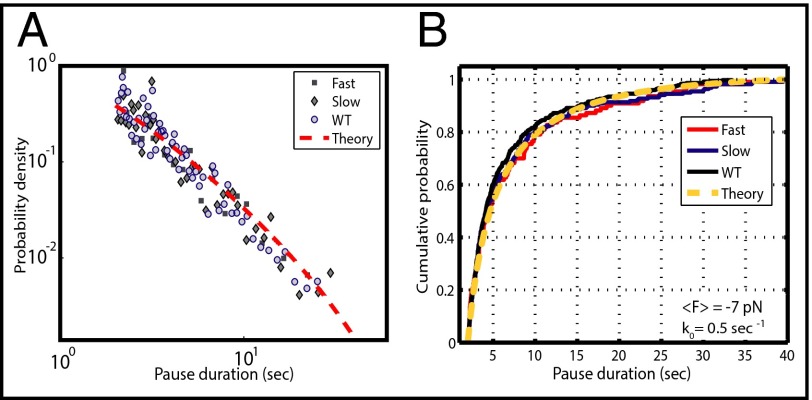
Analysis of pause exit. (A) A double logarithmic plot of pause durations verifies that these distributions are well described by the t−3/2 power law, as has been previously observed (24, 30, 43). Each point in this histogram corresponds to five independent pauses. The red dotted line is the theoretical prediction according to the model developed by Depken et al. (43) using k0 = 0.5 s−1 and F = −7 pN (opposing force). (B) A cumulative probability plot of pause durations (44) for the WT and the fast and slow mutants shows indistinguishable distributions, indicating that the TL has no role in the escape from the paused state. The yellow dotted line is the theoretical curve of the Depken model. A two-sample Kolmogorov–Smirnov statistical test further verifies that the difference between these distributions is not statistically significant. Pauses represented in both plots are between 2 and 40 s and span an opposing force range from 4 to 10 pN (average force = −7 pN).

