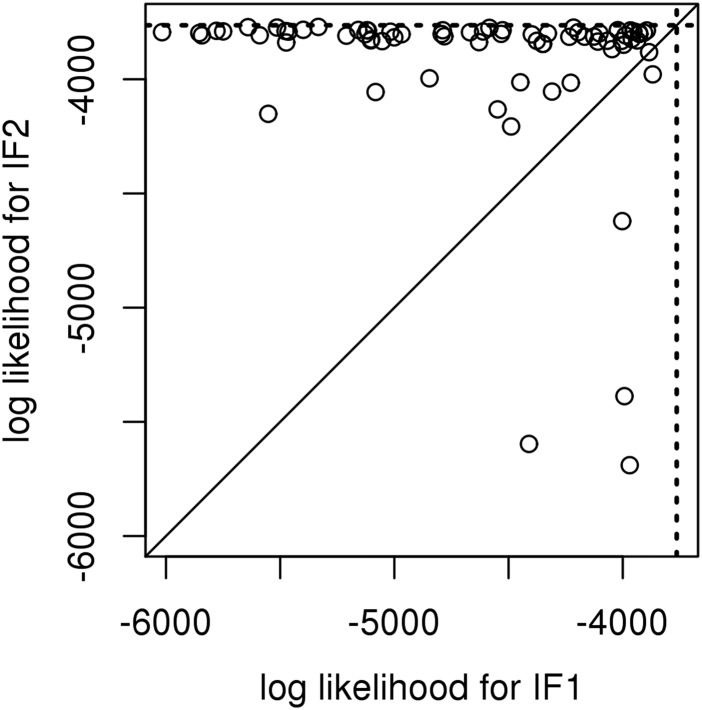
Fig. 2.
Comparison of IF1 and IF2 on the cholera model. Points are the log likelihood of the parameter vector output by IF1 and IF2, both started at a uniform draw from a large hyperrectangle (Table S1). Likelihoods were evaluated as the median of 10 particle filter replications (i.e., IF2 applied with and ) each with particles. Seventeen poorly performing searches are off the scale of this plot (15 due to the IF1 estimate, 2 due to the IF2 estimate). Dotted lines show the maximum log likelihood reported by ref. 10.

