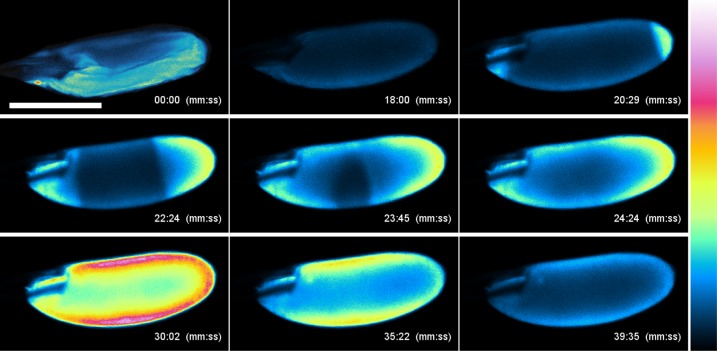
Fig. 2.
In vitro activation of oocytes causes converging Ca2+ waves. Ca2+ flux in oocytes detected by GCaMP3. Oocytes containing GCaMP3 were dissected in IB and activated by replacing IB with AB. Time (in minutes and seconds) after replacement with AB is indicated in each panel. Oocytes gradually swelled from 00:00 to 18:00. A Ca2+ rise was detected at both poles (20:29), extended toward the center of the oocyte, and spread throughout the oocyte at 24:24. The signal intensity was maximum at 30:02, gradually decreased (35:22), and then returned to the basal level (39:35). Calcium rises were seen from both poles in 90% of in vitro-incubated oocytes; the remainder showed a rise from one pole only. We postulate that the difference in relative percentage of bipolar and monopolar rises in vitro vs. in vivo reflects the difference in nature and location of mechanical stress experienced by the oocyte membrane under these two conditions. Fluorescence intensities are presented using a false-color scale, shown on the right. (Scale bar, 200 μm.) n = 14. See Movie S5.

