Fig. 2.
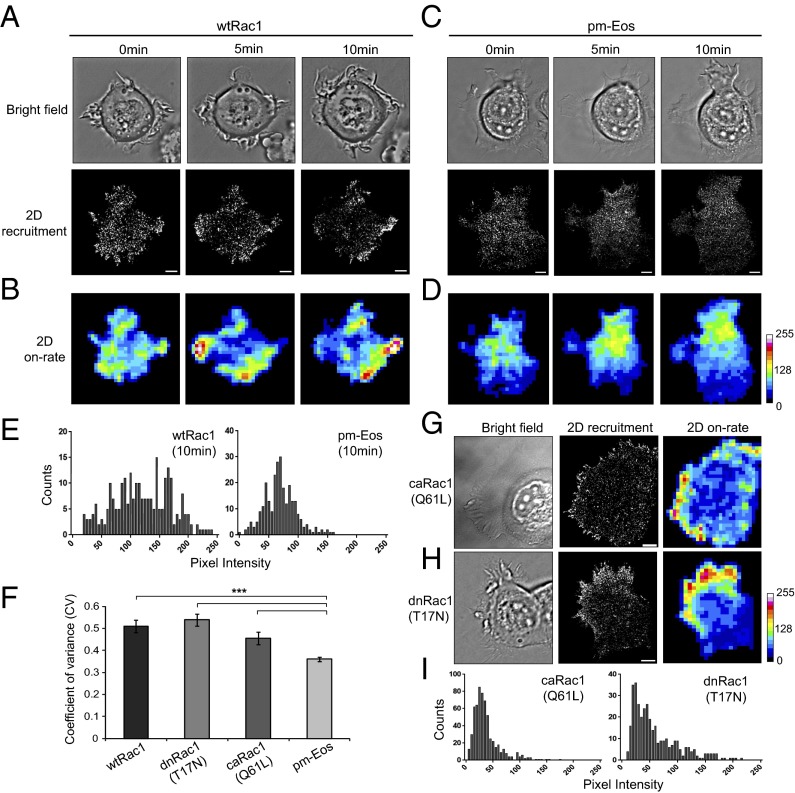
Polarized recruitment of Rac1 to protrusions during cell spreading on collagen. MCF-7 cells expressing wtRac1 were allowed to spread on collagen-coated dishes and imaged thereafter. (A) Time series of an Eos-wtRac1 expressing cell exhibiting the formation of new protrusions (bright field panel). Corresponding 2D recruitment maps show polarized membrane binding of Rac1 to protrusion regions. (B) The 2D on-rate maps represent the binding events per area. Higher intensity indicates hot spots of increased recruitment/on-rates. (C and D) Bright field, 2D recruitment, and 2D on-rate maps of a pm-Eos expressing cell show no preferential Rac1 recruitment to protrusions. (E) Gray-value histograms calculated from 2D on-rate maps for both wtRac1 and pm-Eos expressing cell at 10-min time point. (F) Comparison of CV computed from 2D on-rate maps indicates the dispersion of the gray-value histograms of various constructs. (G and I) Bright field, 2D recruitment, and 2D on-rate maps for caRac1(Q61L) (G) and dnRac1(T17N) (H) expressing cells spreading on collagen, and the corresponding gray-value histograms (I). Scale bar corresponds to 5 μm. Error bars represent SEM for cells. ***P < 0.001. Values for each construct represent data pooled from several independent experiments, wtRac1 (10 cells, 5.8 × 10⁴ trajectories), dnRac1 (7 cells, 4.1 × 10⁴ trajectories), caRac1 (4 cells, 2.4 × 10⁴ trajectories), and pm-Eos (6 cells, 3.0 × 10⁴ trajectories).

