Fig. 4.
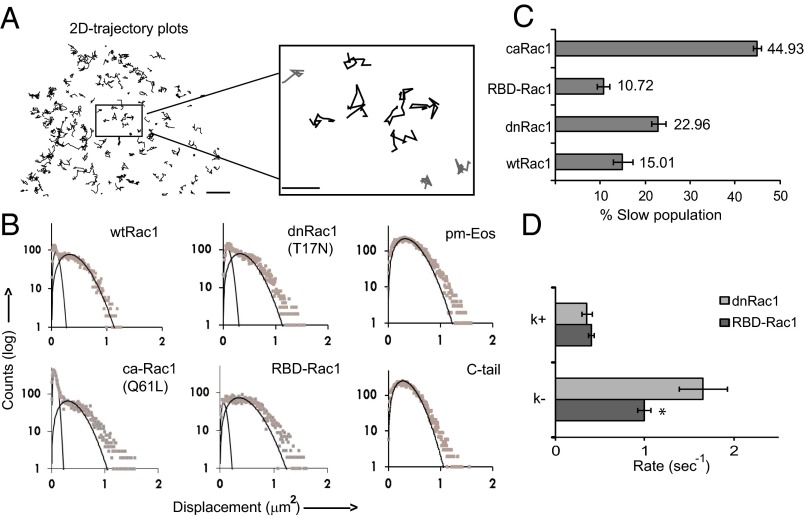
Identification of heterogeneous diffusing populations in membrane-associated Rac1 molecules. MCF-7 cells expressing various Eos-Rac1 constructs and pm-Eos were imaged. (A) Single-molecule trajectories of Rac1 undergoing 2D lateral diffusion on the membrane. A high magnification view shows two types of trajectories: free diffusion (black) and confined diffusion/stationary (gray). (B) Histograms of 2D displacement (ΔT = 125 ms) of the molecules were fitted with a bicomponent 2D diffusion model and the diffusion coefficients for the two populations calculated (Table 1). (C) Representative bar graph showing the percentage of molecules belonging to the slow diffusing (D1) population for different Rac1 constructs. (D) Transition rates between the slow (D1) and the fast diffusing (D2) state, computed by HMM analysis of single-molecule trajectories. The graph represents the rates of association (k+) and dissociation (k−) from the slow (D1) state. Scale bar corresponds to 5 μm. Error bars represent SEM for cells. *P < 0.05. Values for each construct represent data pooled from several independent experiments wtRac1 (10 cells, 5.9 × 10⁴ trajectories), dnRac1 (11 cells, 5.6 × 10⁴ trajectories), caRac1 (9 cells, 5.0 × 10⁴ trajectories), and RBD-Rac1 (9 cells, 4.4 × 10⁴ trajectories).

