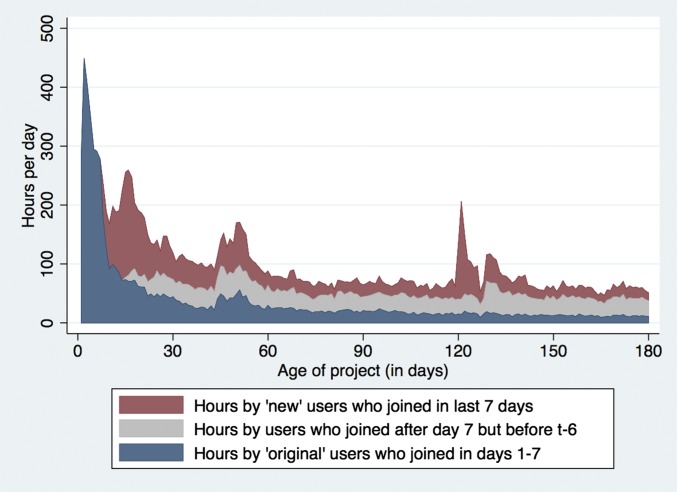
Fig. 5.
Area chart of average daily hours of effort received by the seven projects during the first 180 d of each project’s life. Total effort divided into hours spent by original users (users who joined in the first 7 d of the project; Bottom), new users (users who joined in a rolling window of the last 7 d; Top), and the residual group (users who joined after day 7 of the project but >6 d before the observation day; Middle). Separate graphs for each project are shown in Fig. S4.

