Fig. 1.
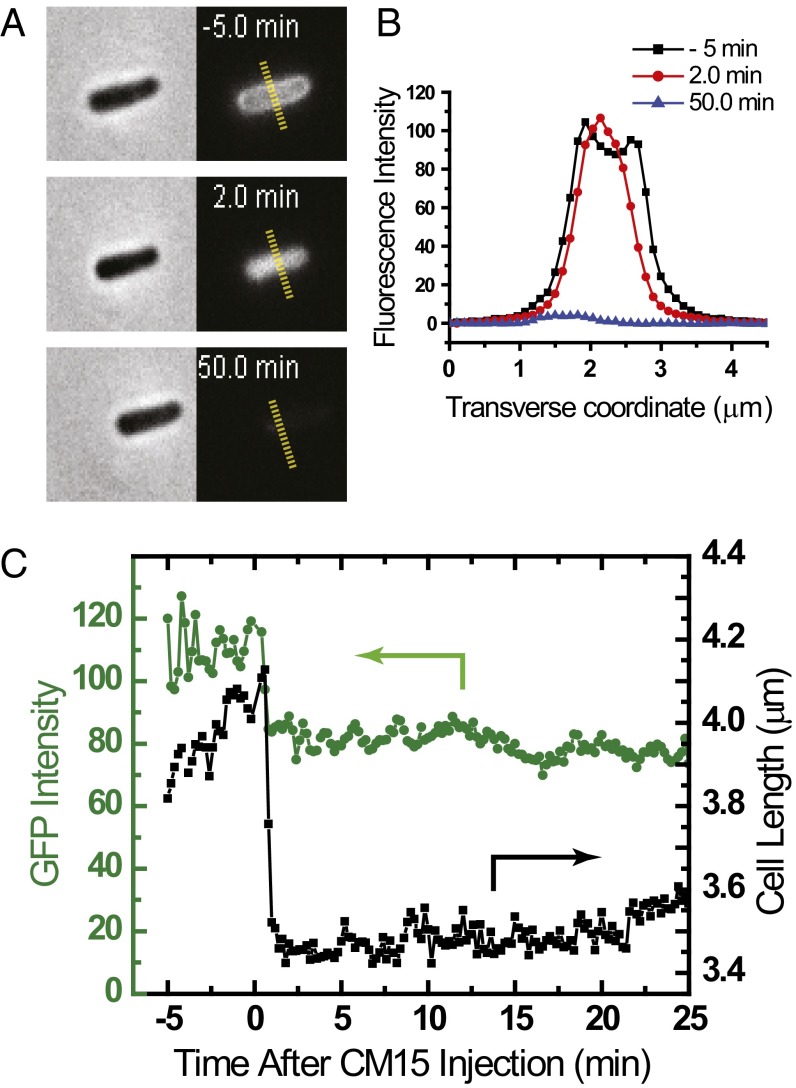
Effects of 10 μM CM15 (twice the 6-h MIC) on MG1655 E. coli expressing periplasmic GFP. (A) Phase contrast and GFP fluorescence images of the same cell 5 min before, 2 min after, and 50 min after the onset of CM15 injection. (B) Transverse intensity linescans along the yellow hashed lines of A, showing periplasmic (−5 min), cytoplasmic (+2 min), and essentially absent (+50 min) GFP spatial distributions. (C) Single-cell time dependence of cell length (from phase contrast images) and total GFP fluorescence intensity before and after injection of 10 μM CM15. Cell length and GFP intensity decrease abruptly and simultaneously as GFP enters the cytoplasm. The decrease in GFP intensity is presumably due to the higher pH in the cytoplasm (14).

