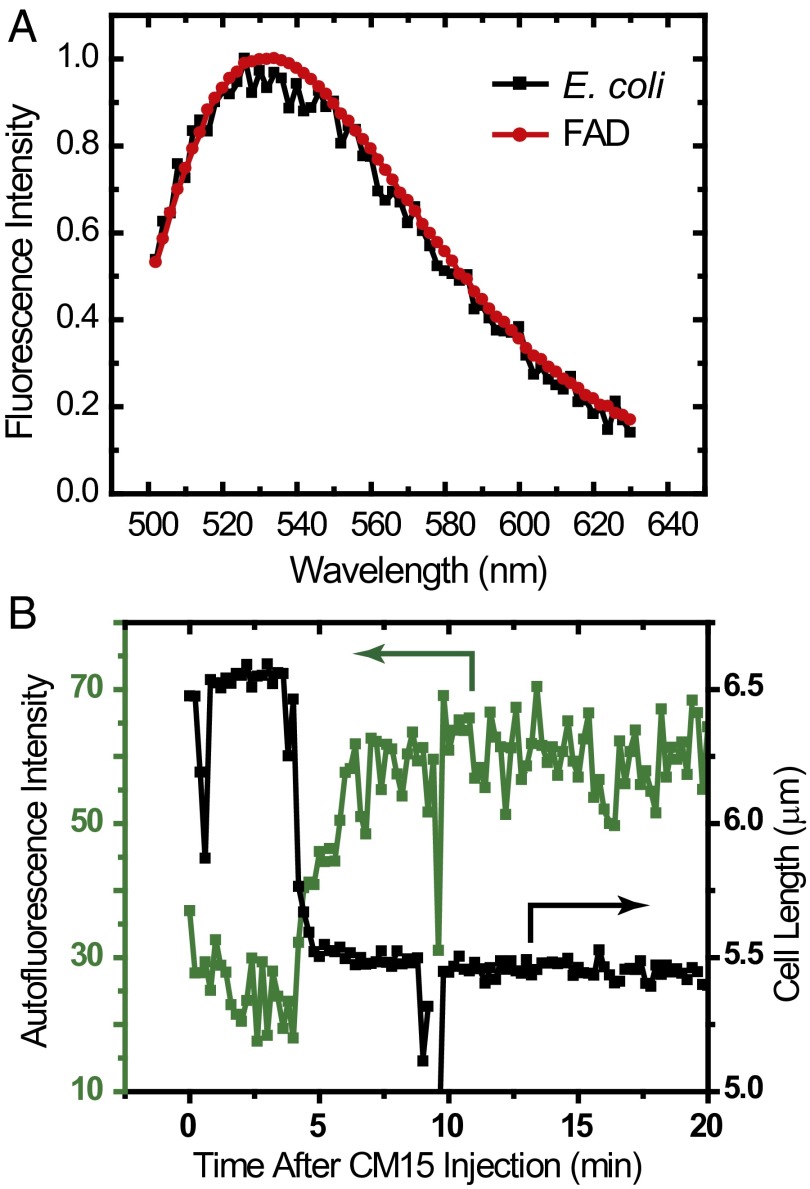
Fig. 2.
(A) Comparison of emission spectra excited at 457 nm for an E. coli cell culture grown at 30 °C to OD600 ∼0.4 and a solution of 100 µM FAD. (B) Single-cell time dependence of cell length (from phase contrast images) and total autofluorescence (excited at 457 nm) before and after injection of 10 μM CM15.

