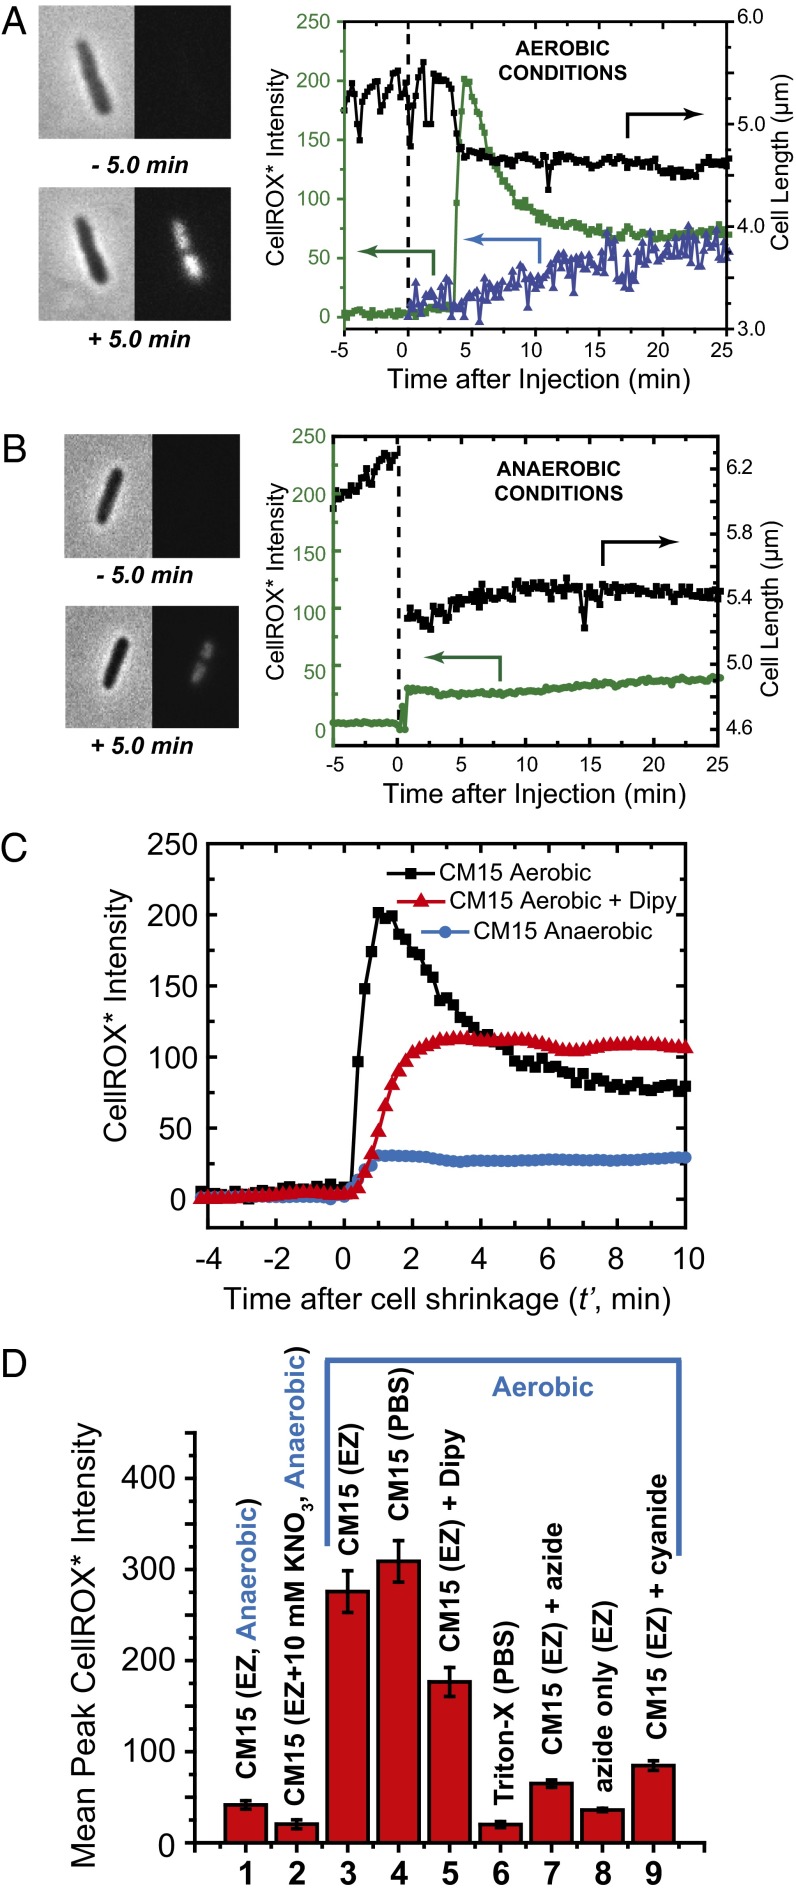
Fig. 3.
CellROX* fluorescence and cell length measurements on addition of 10 μM CM15 in various conditions. (A) Aerobic growth conditions. (Left) Phase contrast and green fluorescence images before and after CM15 addition at t = 0. (Right) Time dependence of cell length (black) and total CellROX* fluorescence intensity (green) for the same cell. Blue data show CellROX* intensity vs. time for a different cell for which CellROX* alone (no CM15) flowed beginning at t = 0. (B) Anaerobic growth conditions. (Left) Phase contrast and green fluorescence images before and after CM15 addition at t = 0. (Right) Time dependence of cell length and total CellROX* fluorescence intensity. (C) Comparison of representative single-cell CellROX* fluorescence intensity traces after CM15 addition in aerobic conditions, in aerobic conditions with addition of 2,2′-dipyridyl (iron chelating agent), and in anaerobic conditions. (D) Bar graph of mean, single-cell CellROX* peak fluorescence intensity in nine different sets of experimental conditions. Error bars are ±1 SD of the mean in each condition. 1 and 2: Anaerobic conditions. CM15 addition to cells in standard EZRDM medium and in EZRDM supplemented with 10 mM KNO3, respectively. 3–9: Aerobic conditions as follows. 3: CM15 addition to cells growing in EZRDM. 4: CM15 addition after rinsing cells with PBS to remove external iron. 5: CM15 addition in EZRDM to cells pretreated with 2,2′-dipyridyl to chelate free cytoplasmic iron. 6: No CM15; addition of 2% Triton-X in PBS. 7: CM15 addition to cells pretreated with 15 mM azide (NaN3). 8: No CM15. Addition of 15 mM azide alone to cells growing in EZRDM. 9: CM15 addition to cells pretreated with 1 mM cyanide (NaCN). See text for additional details.

