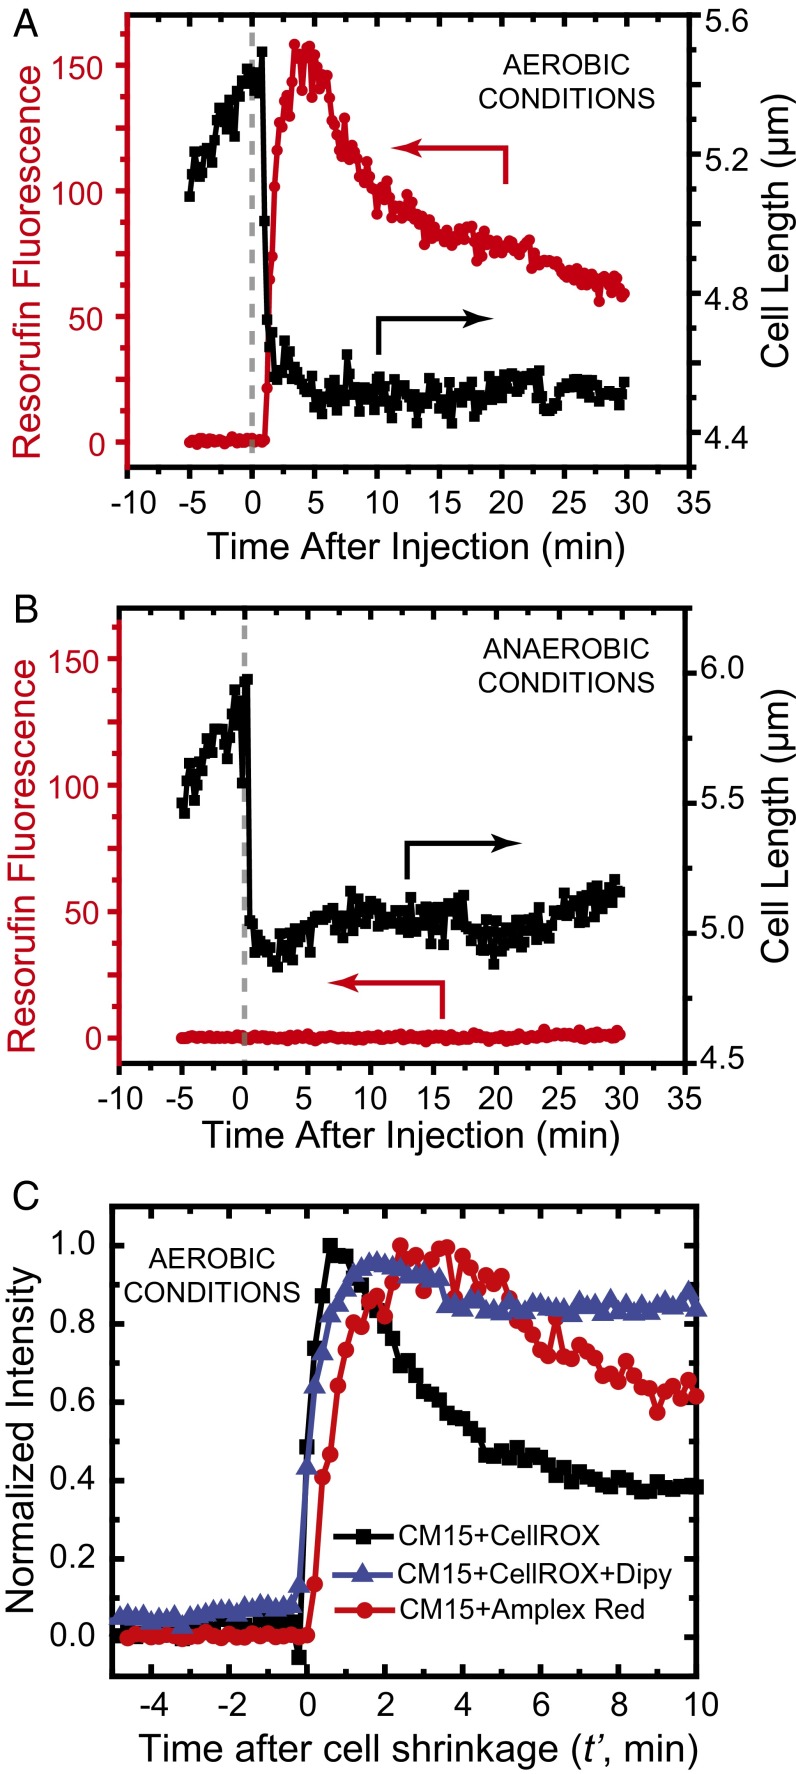
Fig. 4.
Single-cell detection of H2O2 production following CM15 addition to cells expressing the nonnative peroxidase APEX2 from a plasmid. (A) Aerobic growth conditions. Single-cell measurement of resorufin fluorescence vs. time after addition of 10 μM CM15 at t = 0. Signal begins to rise within 12 s of cell shrinkage event. (B) Same as A, but for growth in anaerobic conditions. (C) Comparison of rising edge of CellROX* signal (with and without 2,2′-dipyridyl) and of resorufin signal after 10 μM CM15 treatment. Each trace is an average of five experiments, and the traces are normalized to the same peak intensity to facilitate comparisons. Time t′ = 0 is the moment of cell shrinkage, used to place all cells on a common time axis.

