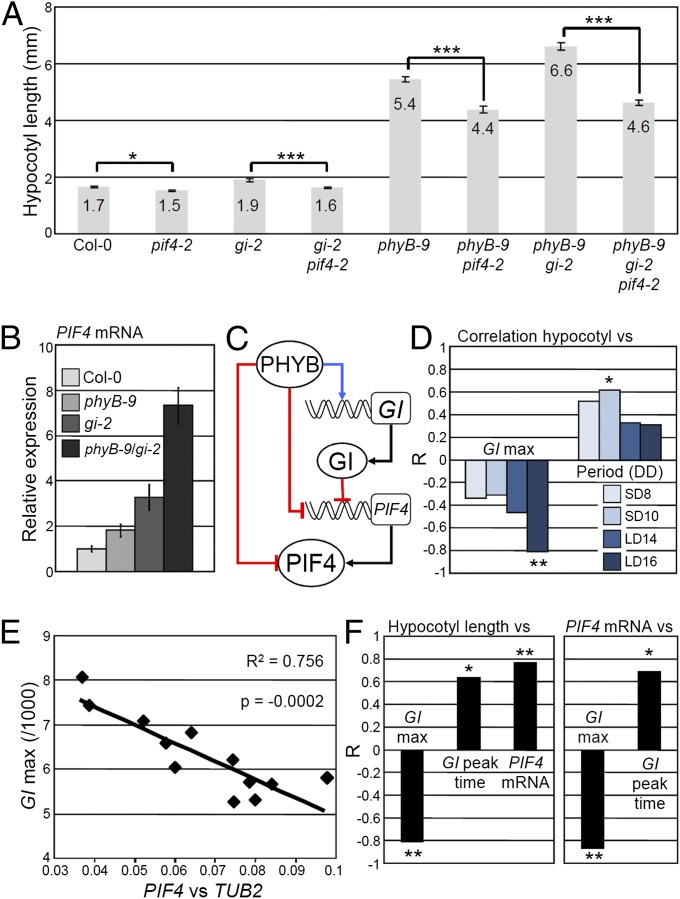
Fig. 3.
Precise changes in GI expression modify PIF4 expression and growth. (A) Hypocotyl length and (B) PIF4 mRNA levels at zeitgeber time (ZT) 20 h, quantified by quantitative RT-PCR (qRT-PCR) in LDs of 16 h in the indicated mutant backgrounds. (C) Working model for how PHYB and GI interact to regulate growth. Red lines indicate repression, blue lines activation, and black lines translation. Rectangles and circles represent genes and proteins, respectively. (D) Correlation of hypocotyl length of the NILs grown in LDs of 16 h with GI::LUC expression level at peak time (GI max) and period length in DD after entrainment in four photoperiods. (E) Correlation between GI::LUC expression level at peak time (GI max) and PIF4 mRNA levels quantified by qRT-PCR in the NILs entrained in LDs of 16 h and sampled at ZT 20 h. (F) Correlation among growth, GI::LUC expression level at peak time (GI max), GI peak time, and PIF4 mRNA levels at ZT 20 h. The Pearson correlation coefficient (R) indicates the strength of the correlations, with 1 and −1 indicating perfect positive and negative correlations, respectively. *P ≤ 0.05, **P ≤ 0.01, and ***P ≤ 0.001, with (A) a two-tailed Student t test or (D and F) the Pearson test. The correlations were also tested with the Spearman test and yielded similar results.

