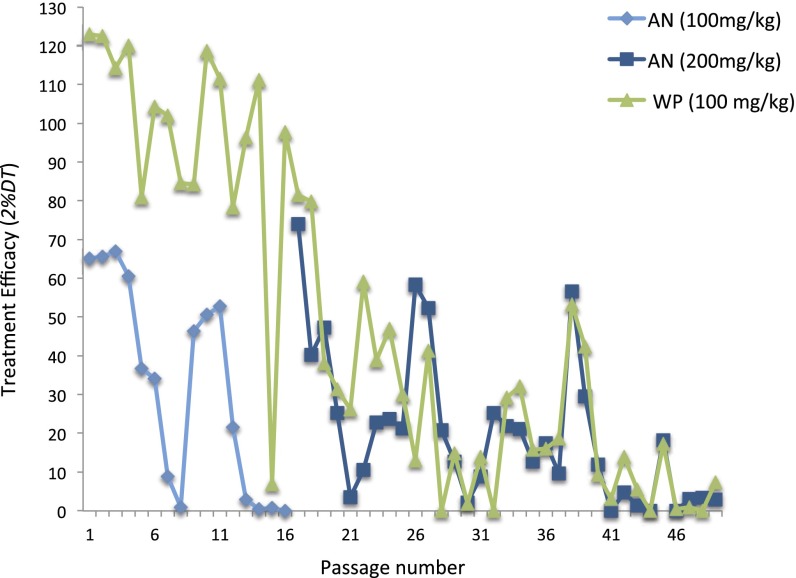
Fig. 3.
Experimental evolution of drug resistance in P. chabaudi (ASS) following the 2% relapse technique. Selection for resistance in P. chabaudi required more passages in mice administered WP (green) than in mice receiving AN (blue). Drug efficacy (y axis) is measured as the difference in time to reach 2% infected red blood cells between treated and untreated animals. Consistent with evolution of resistance, drug efficacy (2%DT) waned over time for all groups. However, AN ceased impairing parasite replication by passage 16, whereas the equivalent dose of WP never resulted in total loss of efficacy. When 2%DT for “AN (100 mg/kg)” reached zero, the dose of AN was doubled (200 mg/kg), but this only temporarily restored drug efficacy as stable resistance to that dose was achieved by passage 46.

