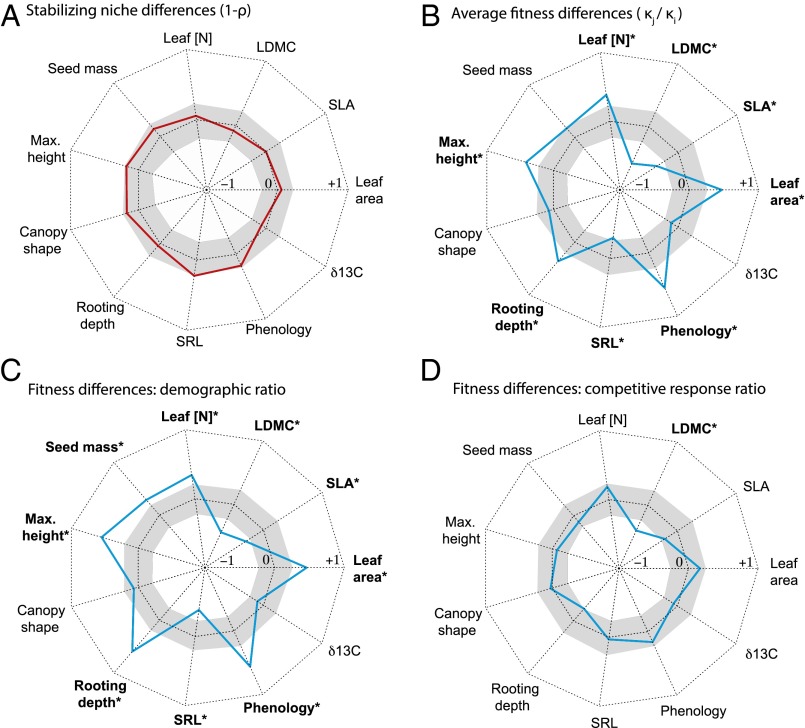
Fig. 1.
Functional trait correlates of stabilizing niche (A) and average fitness (B) differences among 18 annual plants. Because average fitness and stabilizing niche differences are pairwise measures, correlations are calculated with Mantel tests. (C and D) Trait correlations with the two components of fitness differences, the demographic ratio and the competitive response ratio. Colored lines show correlations calculated from the Mantel test, ranging from −1 at the center of the plot to 1 at the margin. Central band of gray denotes the central 95% of null correlation values from the mantel permutations. See Table 2 for trait abbreviations. Results that are significant following Benjamini–Hochberg correction for multiple comparisons (Table S2) are marked in bold with an asterisk.

