
Figure 4.
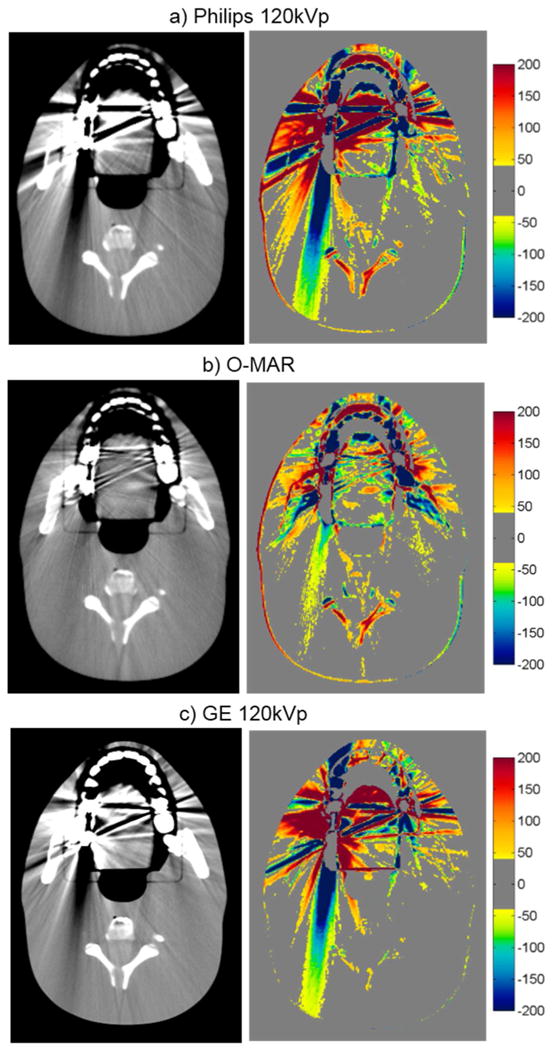
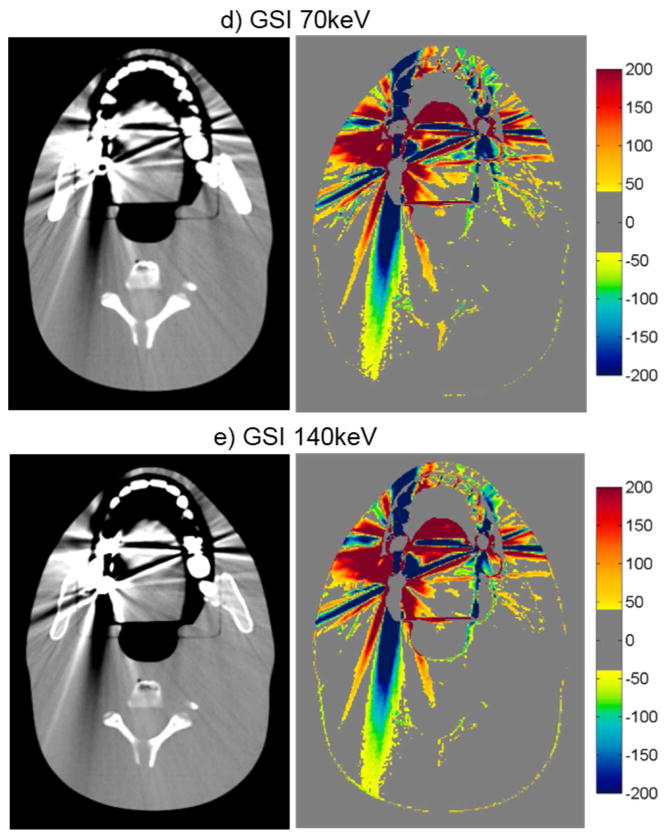
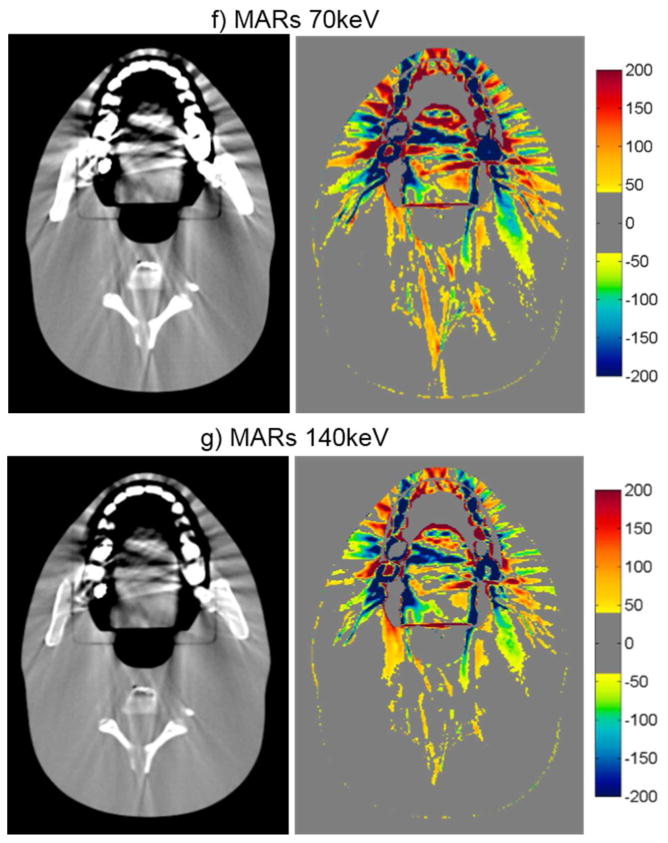
CT images of the head phantom with dental fillings (WL=0, WW=500), side by side with the corresponding CT number difference maps between the baseline and the metal scans of the phantom for uncorrected imaging methods (“Philips 120kVp” and “GE 120kVp”) and artifact mitigation methods (“O-MAR”, “GSI”, and “MARs”).