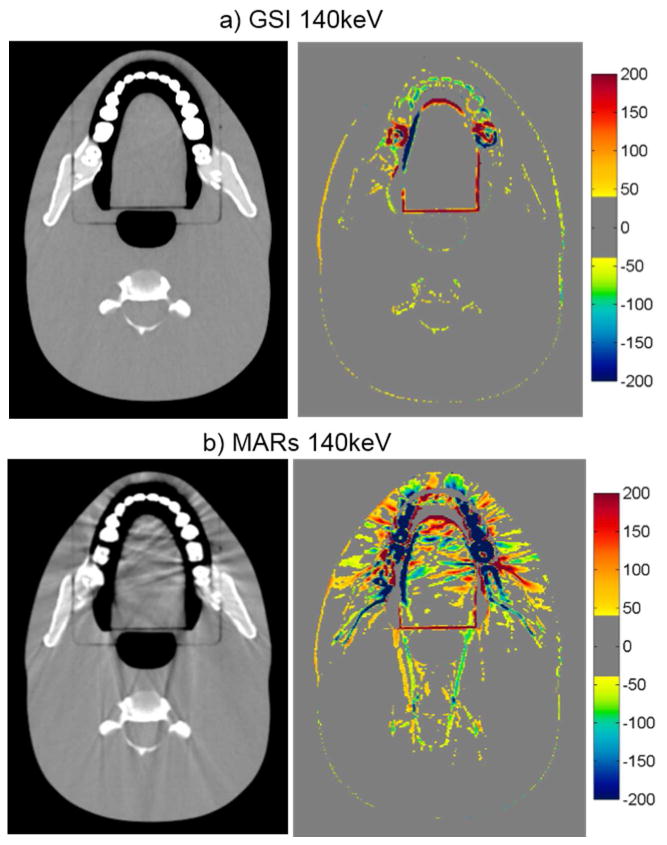
Figure 5.

Grayscale CT images of the head phantom with dental fillings (WL=0, WW=500), side by side with the corresponding CT number difference maps between the baseline and the metal scans of the phantom for a) GSI 140keV and b) MARs 140keV imaging. Shown is an image of the head phantom that does not contain any portion of the metal fillings, illustrating out-of-plane artifacts introduced by the MARs algorithm.
