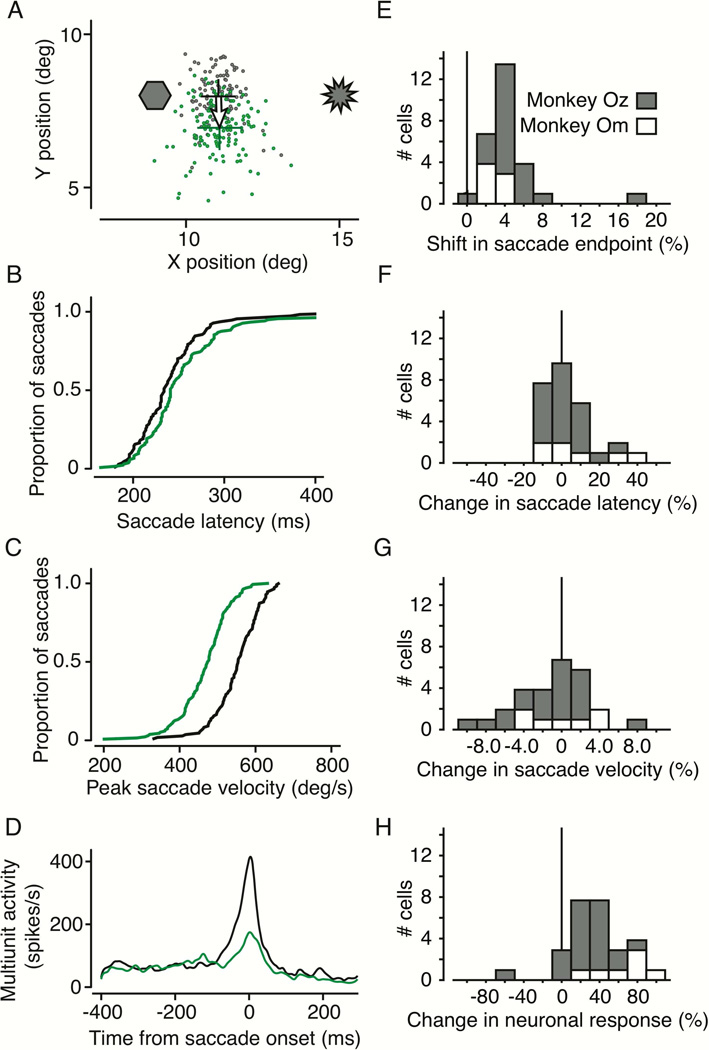
Figure 1. Example behavioral effects from optogenetic control.
A) Saccades with and without laser stimulation directed to a visual target at 11.5°, 8.0°. Saccade endpoints are shown without (gray) and with (green) laser stimulation. Laser light was introduced into the intermediate layers of the SC on randomly interleaved trials. This was done by opening and closing a fast shutter placed in the path of the laser, which remained on throughout the experiment. Green and black crosses indicate the mean saccade endpoints (± 1SE) with and without light, respectively. This example was chosen as a clear demonstration, but most results were based on fewer trials. B) Cumulative distribution of saccade latencies. Black are latencies without light, green are in the presence of laser light. C) Cumulative distributions of peak saccade velocity. The green trace shows peak velocity in the presence of laser light, and the black trace is without light. D) Multiunit neuronal activity with and without laser stimulation. Neuronal responses are shown as spike density histograms aligned to saccade onset at time zero and smoothed with a Gaussian filter with a 5ms SD. E) Distribution of saccadic endpoint shifts from photostimulation for 28 experiments in two monkeys (21 on monkey OZ, 7 in monkey Om). F) Distribution of changes in saccade latency due to photostimulation. G) Distribution of changes in peak saccade velocity due to photostimulation. H) Distribution of changes in neuronal response due to photostimulation.

