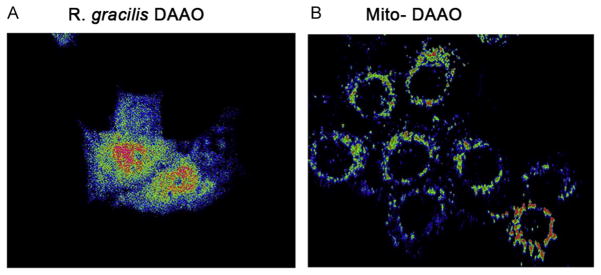
Figure 14.4.

Fluorescent imaging of ROS expression in DAAO targeted expression cells DCF fluorescent images of HT22 cells transduced with either (A) R. gracilis DAAO or (B) mito DAAO, that produce H2O2 in either the cytoplasm or mitochondria. Fluorescent intensity was converted to red to black color gradient, where red indicates high fluorescent intensity and blue represents low.
