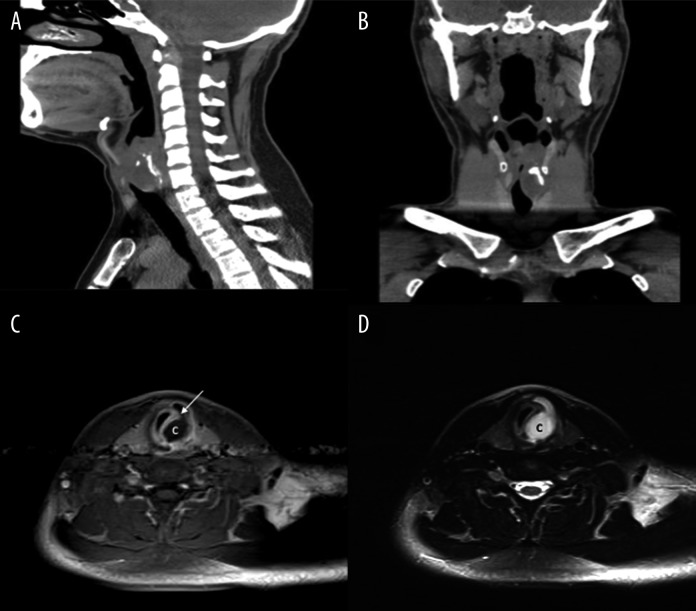
Figure 2.
Neck CT. Sagittal (A) and coronal (B) images showing a low-attenuation subglottic laryngeal mass containing calcifications and protruding into the lumen of the larynx with 75% luminal obstruction and destruction of the arytenoid and cricoid cartilage, Neck MRI. T1W post-contrast (C) and T2W (D) images showing a mixed solid and cystic submucosal mass in the subglottic larynx. The cystic component (c) shows low T1 and high T2 signal intensity, whereas the solid component (arrow) shows contrast enhancement.

