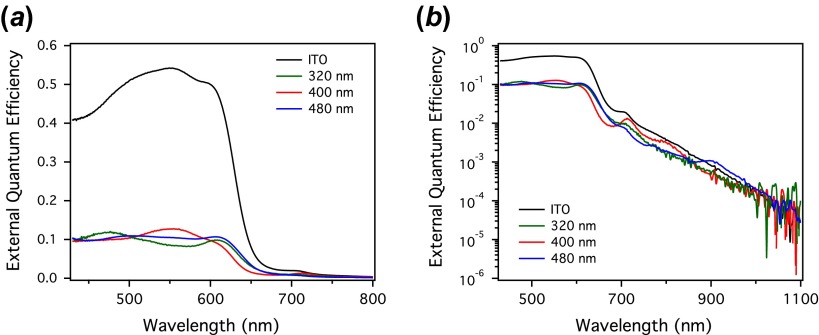
Figure 5.
FT photocurrent spectra of (300 μm)2 area devices on a (a) linear and (b) log scale for organic photovoltaic devices with perforated metal film transparent contacts (hole array pitches of 320 nm (green), 400 nm (red), and 480 nm (blue), along with a reference device (black) utilizing an ITO transparent contact. On a log scale, weak absorption by CT states can be visualized with over six orders of magnitude dynamic range. (The colour version of this figure is included in the online version of the journal.)

