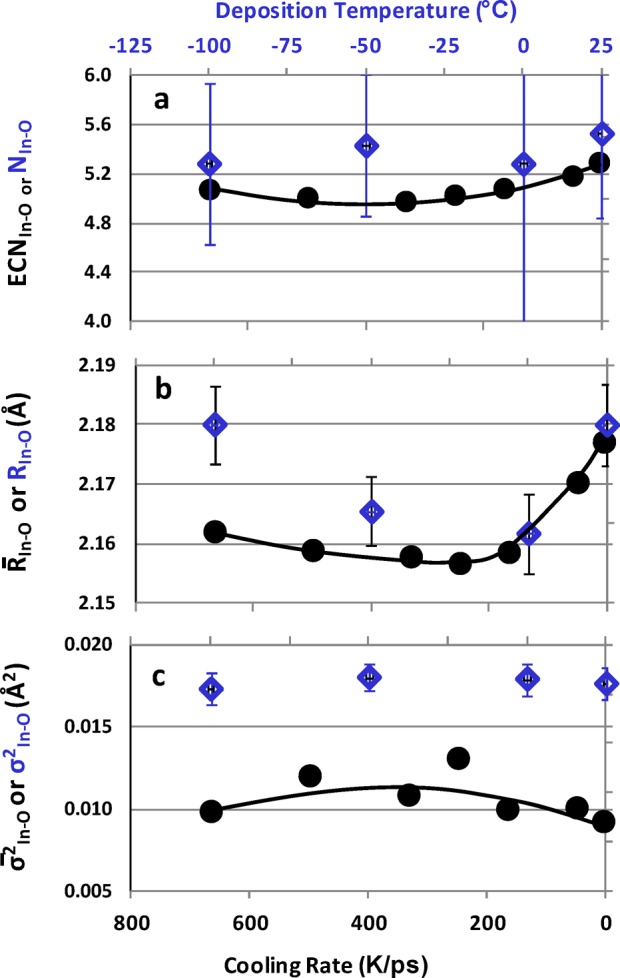
Figure 10.

First-shell, In–O. (a) Effective coordination number, (b) average bond distance, and (c) bond-distance statistical spread obtained from the MD simulations for 80-atom cell a-InO with different cooling rates on bottom axis (black circle markers). Blue diamond markers, low deposition temperature region (top axis) of EXAFS data.
