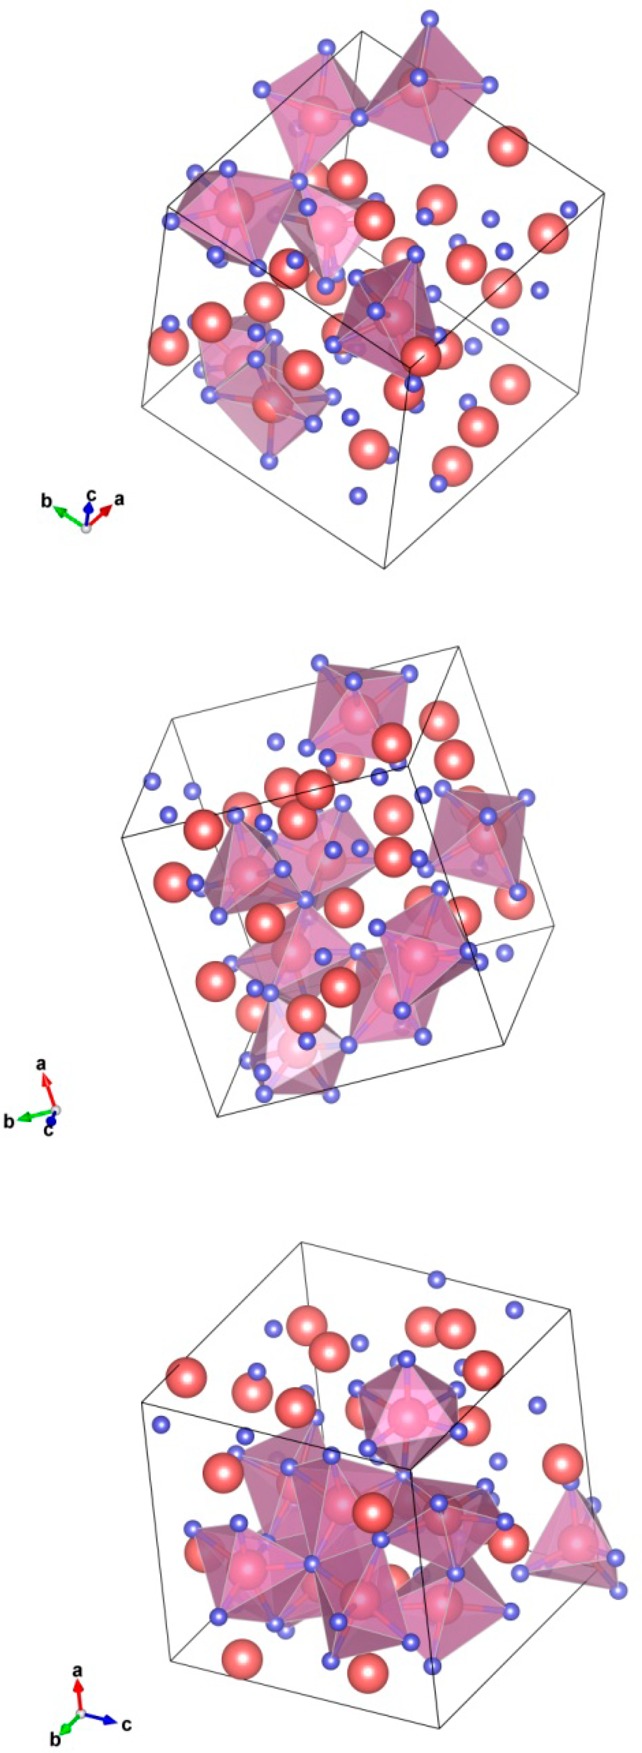
Figure 15.

Spatial distribution and connectivity of the InO6 polyhedra in amorphous InO obtained via 500 K/ps (top), 250 K/ps (middle), and 50 K/ps (bottom) cooling rates. Indium and oxygen atoms are shown with large (red) and small (blue) balls. Only InO6 polyhedra are shown in these plots.
