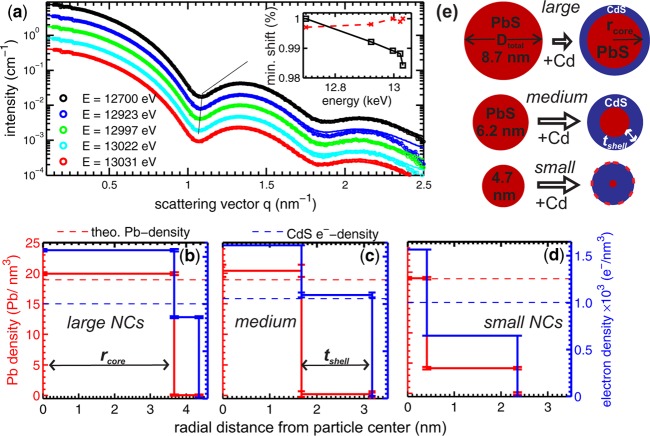
Figure 2.
(a) Experimental ASAXS curves (symbols) fitted with a unique spherical core/shell model (lines) for the large core/shell PbS/CdS NC-sample after 1 h of reaction time. The absolute intensity I(q,E) plotted over the scattering vector q was recorded at five different X-ray energies below the Pb-LIII-edge. The curves, except the black one, are shifted vertically by a factor of 2 for clarity. Inset: The squares show the shift in q of the first minimum in the ASAXS curve as a function of E, whereas the red dashed line shows the position of the pure PbS NC as reference. In (b), (c), and (d) the resulting density profiles for the large, medium, and small sized PbS/CdS samples are depicted. The Pb-density (red line) is plotted on the left axis and the total electron density (blue line) on the right axis as a function of the distance from the particle center. (e) Scheme of the final shell formation for all three initial particle sizes, i.e., large, medium, and small, after maximum exchange time.

