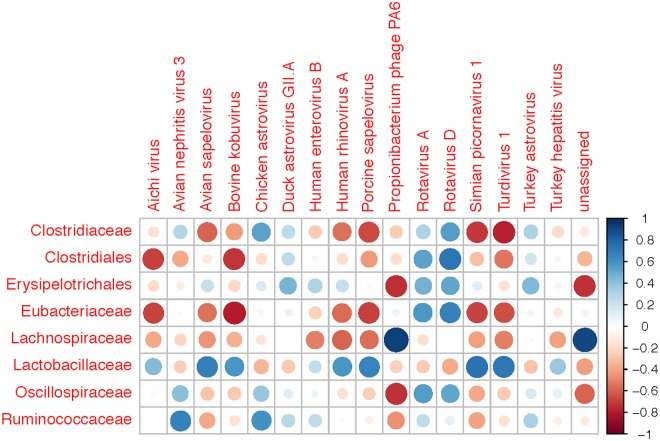
Fig 4. Correlation Matrix.
Correlation matrices comparing viral taxa to bacteria at the Family level. The color and size of the cross-referenced circles corresponds to the level of correlation between groups. The legend indicates correlations (r values) ranging from-1 (strong negative correlation) to +1 (strong positive correlation).

