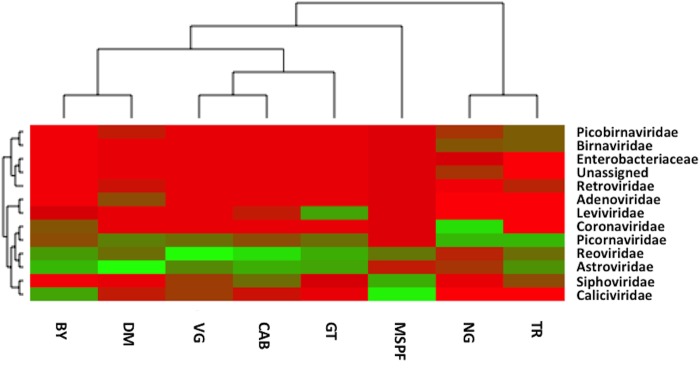
Fig 5. Viral Metagenome Heat Map.

Heat map with dendogram (x-axis) representing the relationships between pre-contact MSPF birds and sentinel birds placed in contact with birds in the field. Family level viral comparisons are indicative of the viral abundance counts (y-axis) for each metagenome.
