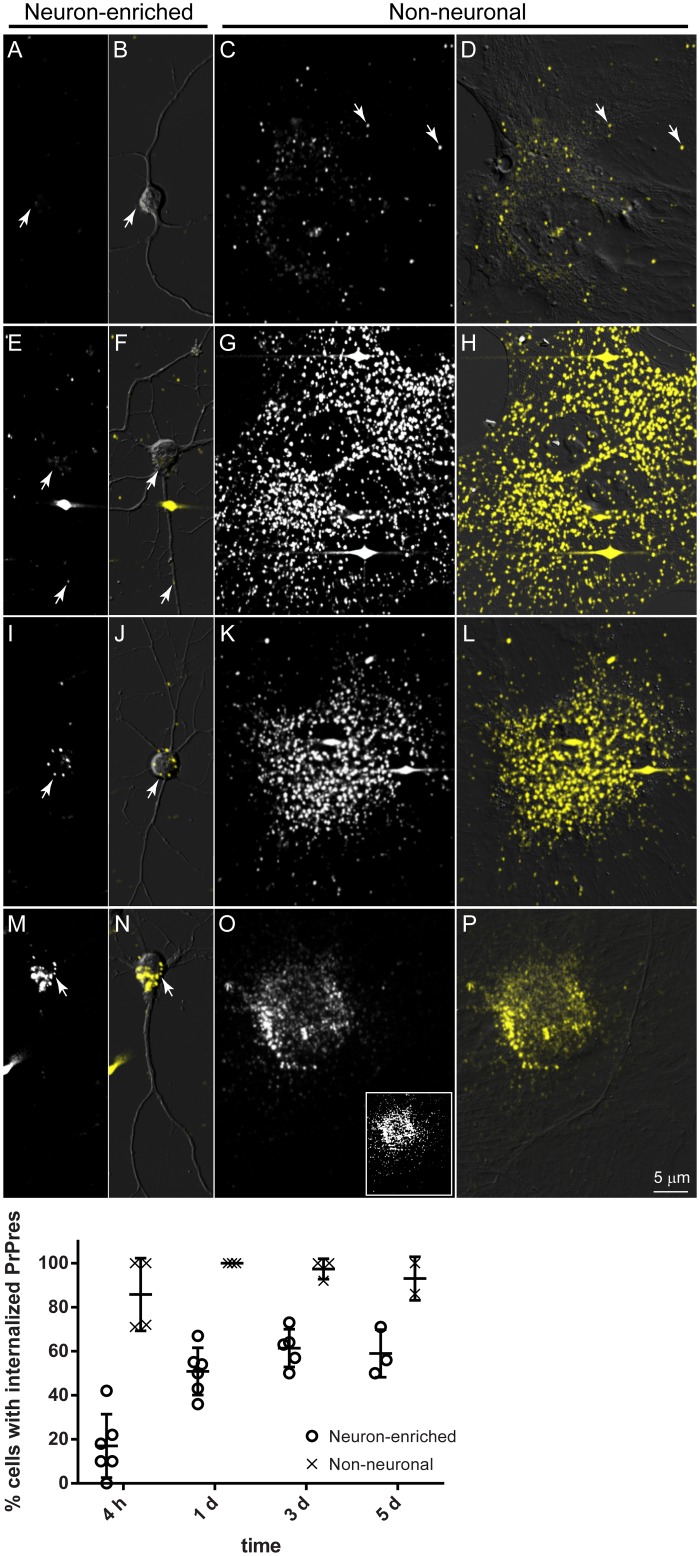
Fig 5. Non-neuronal cells internalize PrPres more efficiently than neurons.
Neuron-enriched and non-neuronal primary cultures were incubated with 263KA647 and observed by live cell confocal microscopy at 4–6 h (A-D), 1 day (E-H), 3 days (I-L), or 5 days (M-P) post-exposure. After 4–6 h of incubation, fluorescent aggregates (arrows) were observed on cell surfaces in both cultures (A and C). The percentage of cells with internalized PrPres was significantly higher in non-neuronal cultures at all time points. Progressive accumulation of PrPres within non-neuronal cells necessitated imaging with about two-fold lower laser intensity at 5 dpe (panel O) to prevent detector saturation. Inset in panel O represents image of same field of view as panel O with same laser power setting used for panels C, G, and K. Panels B, D, F, H, J, L, N, and P show fluorescence images merged with the corresponding DIC images. Images A, E, I, and M are maximum intensity Z projections of optical sections totaling 3.5–6.5 μm and starting about 1.5 μm above the coverslip. Images C, G, K, and O are maximum intensity Z projections of optical sections totaling 1–4.5 μm and starting about 0.5 μm above the coverslip. The graph summarizes data accumulated over at least three independent experiments totaling between 39 and 67 cells observed at each time point for neuron-enriched cultures or at least two independent experiments totaling between 60 and 98 cells observed at each time point for non-neuronal cultures. All cells imaged were randomly chosen by initially viewing samples by DIC only (no fluorescence). Bars on graph represent mean ± standard deviation (SD).

