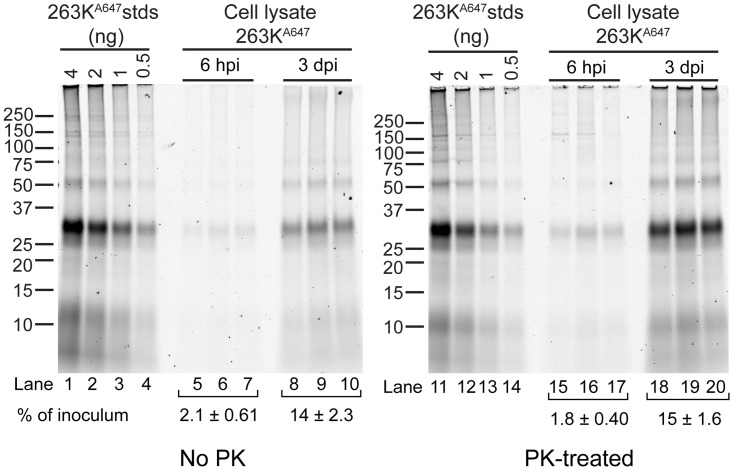
Fig 11. Biochemical characterization of internalized fluorescent aggregates in non-neuronal cells.
Non-neuronal cells were treated with 263KA647 for the indicated times prior to lysis. No PK (lanes 5–10) samples correspond to 20% equivalents of cell lysates subjected to methanol precipitation. PK-treated (lanes 15–20) samples correspond to 70% equivalents of cell lysates subjected to PK digestion and PTA precipitation. Samples were analyzed by fluorescence SDS-PAGE. Lanes 1–4 and 11–14 contain dilution series of 263KA647 inocula that were processed identically to cell lysate samples but without application to the cells to serve as quantitation standards for input 263KA647. Numbers (% of inoculum) represent mean amount of PrPres recovered at each time point as a percentage of the corresponding inoculum ± SD (n = 3).

