Abstract
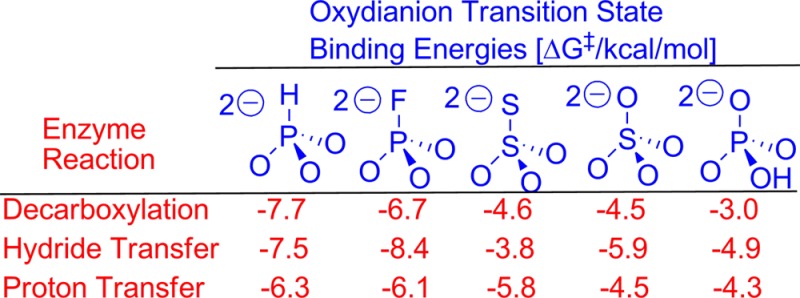
The kinetic parameters for activation of yeast triosephosphate isomerase (ScTIM), yeast orotidine monophosphate decarboxylase (ScOMPDC), and human liver glycerol 3-phosphate dehydrogenase (hlGPDH) for catalysis of reactions of their respective phosphodianion truncated substrates are reported for the following oxydianions: HPO32–, FPO32–, S2O32–, SO42– and HOPO32–. Oxydianions bind weakly to these unliganded enzymes and tightly to the transition state complex (E·S‡), with intrinsic oxydianion Gibbs binding free energies that range from −8.4 kcal/mol for activation of hlGPDH-catalyzed reduction of glycolaldehyde by FPO32– to −3.0 kcal/mol for activation of ScOMPDC-catalyzed decarboxylation of 1-β-d-erythrofuranosyl)orotic acid by HOPO32–. Small differences in the specificity of the different oxydianion binding domains are observed. We propose that the large −8.4 kcal/mol and small −3.8 kcal/mol intrinsic oxydianion binding energy for activation of hlGPDH by FPO32– and S2O32–, respectively, compared with activation of ScTIM and ScOMPDC reflect stabilizing and destabilizing interactions between the oxydianion −F and −S with the cationic side chain of R269 for hlGPDH. These results are consistent with a cryptic function for the similarly structured oxydianion binding domains of ScTIM, ScOMPDC and hlGPDH. Each enzyme utilizes the interactions with tetrahedral inorganic oxydianions to drive a conformational change that locks the substrate in a caged Michaelis complex that provides optimal stabilization of the different enzymatic transition states. The observation of dianion activation by stabilization of active caged Michaelis complexes may be generalized to the many other enzymes that utilize substrate binding energy to drive changes in enzyme conformation, which induce tight substrate fits.
Introduction
Studies on the origin of enzymatic rate enhancements often focus on understanding the intermolecular electrostatic, hydrogen bonding and hydrophobic interactions responsible for stabilization of enzymatic transition states.1 These interactions may be characterized for a particular enzyme in mutagenesis studies, with the aim of determining whether the sum of stabilizing protein–ligand interactions is sufficiently large to account for the observed transition state stabilization.2−4 We are interested in the more general problem of defining paradigms for enzyme architecture, which favor large enzymatic rate accelerations across broad spectra of enzyme-catalyzed reactions.4−9
Enzyme-catalyzed decarboxylation by orotidine monophosphate decarboxylase (OMPDC),10 proton transfer by triosephosphate isomerase,11−13 and by OMPDC,14,15 hydride transfer by α-glycerol phosphate dehydrogenase (GPDH),16 and phosphoryl transfer by α-phosphoglucomutase17 proceed through strikingly different transition states, yet each transition state is stabilized by 11–13 kcal/mol by interactions with the nonreacting phosphodianion of substrate. These enzymes interact with substrate through a gripper loop, and we have proposed that the wide distribution of these loops,18−22 and of phosphate cups,23 reflects their common function in providing a large intrinsic phosphodianion binding Gibbs free energy.6,24,25
Loop-phosphodianion binding interactions anchor substrates to enzymes and are expressed at the Michaelis complex. However, the 11–13 kcal/mol intrinsic Gibbs phosphodianion binding free energy, determined from the ratio of the second-order rate constant kcat/Km (Figure 1) for the enzyme-catalyzed reaction of the whole substrate and (kcat/Km)E for reaction of the truncated substrate alone, exceeds the total substrate binding energy for the reactions catalyzed by TIM, OMPDC and GPDH, so that a significant fraction of these dianion binding interactions are expressed specifically at the transition state for the catalyzed reaction.10,12,14,16 We separated the anchoring and activating interactions of the phosphodianion by cutting the covalent connection to the reacting substrate10,12,14,16 and characterizing activation of enzyme catalysis of a phosphodianion truncated substrate by phosphite dianion. The dianion binding energy recovered as activation by the phosphite dianion piece (6–8 kcal/mol) is determined from the ratio of the third-order rate constant kcat/KHPiKd (Figure 1) for the enzyme-catalyzed reaction of the pieces and the second order rate constant (kcat/Km)E for reaction of the truncated substrate alone.10,12,14,16,26
Figure 1.
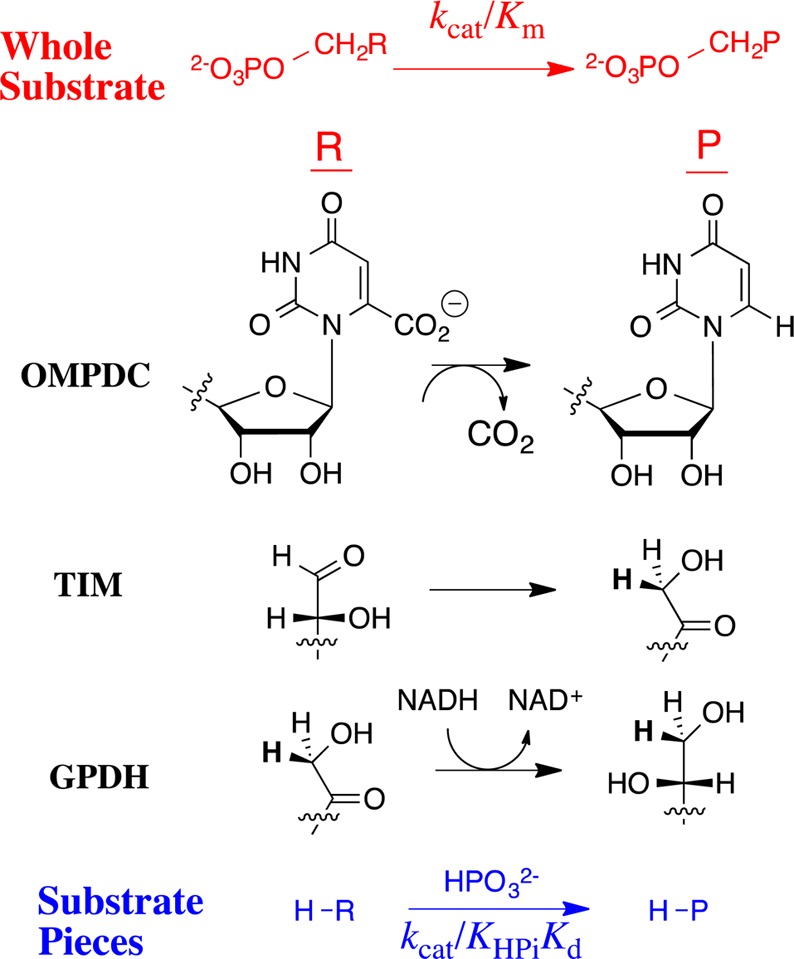
Reactions of whole substrates RCH2OPO32– (kcat/Km) and the pieces RH + HPO32– (kcat/KHPiKd) catalyzed by OMPDC, TIM and GPDH. A total 11–13 kcal/mol Gibbs phosphodianion binding free energy for RCH2OPO32– and 6–8 kcal/mol phosphite dianion binding energy for R–H is utilized in the stabilization of the transition states for the respective enzyme-catalyzed decarboxylation, proton and hydride transfer reactions.10,12,16,26 The 4–6 kcal/mol difference between the phosphodianion and phosphite dianion binding energy is the entropic advantage that arises from the covalent connection between the substrate pieces.4,5,27
The transition states for the enzyme-catalyzed reactions of the whole substrate and the substrate pieces were examined by comparing the effects of site-directed mutations at TIM and at OMPDC on the kinetic parameters kcat/Km (M–1 s–1) and kcat/KHPiKd (M–2 s–1) for the respective bimolecular and termolecular enzymatic reactions (Figure 1). In both cases a slope of 1.0 was observed for a logarithmic plot of kcat/Km (M–1 s–1) against kcat/KHPiKd (M–2 s–1) for reactions catalyzed by the respective wildtype enzyme and by a broad range of mutant enzymes. This shows that the mutations result in the same change in the activation barriers for the enzyme-catalyzed reactions of whole substrate and the substrate in pieces.4,5 The results are consistent with reactions that proceed through transition states of essentially the same structure and that interact in the same manner with the protein catalyst, but with an entropic advantage to reaction of the whole substrate. They allow partitioning of the total 11–13 kcal/mol Gibbs dianion binding free energy into the 6–8 kcal/mol binding energy expressed at the transition state for the catalyzed of reaction phosphite dianion, and the additional 4–6 kcal/mol entropic (anchoring) effect from connecting the substrate pieces (Figure 1).4,5
Our model for enzyme activation by oxydianions follows from the function of the oxydianion to drive closure of a flexible gripper loop over the enzyme-bound substrate.6,11,25 The ligand-driven conformational change converts enzymes from an inactive open form to an active closed form, which traps the substrate in a catalytically active protein cage. The dianion acts by providing the electrostatic glue required to lock enzymes in their closed forms. However, the dianion is a spectator, in the sense that its binding has little or no effect on the chemistry at the catalytic site.6,24,25 This proposal folds back onto an earlier suggestion to rationalize enzyme specificity through ligand driven protein conformational changes that induce tight fits for the substrate at the enzyme active site.22,28−36 Its power is derived from the generality of a mechanism that provides specificity in the binding of any nonreactive substrate fragment to the enzyme–transition state complex, provided the binding energy is utilized to stabilize an active enzyme–substrate cage that shows specificity in binding to the reaction transition state complex.6,24
We are interested in determining and comparing structure–function relationships for the dianion binding sites of yeast TIM (ScTIM), yeast OMPDC (ScOMPDC) and human liver GPDH (hlGPDH). ScOMPDC-catalyzed decarboxylation of (1-β-d-erythrofuranosyl)orotic acid (EO) to form (1-β-d-erythrofuranosyl)uracil (EU) is activated by a series of five tetrahedral oxydianions, which bind weakly to unliganded OMPDC and tightly to the enzyme–transition state complex, with the following intrinsic oxydianion binding energies (kcal/mol): SO32–, −8.3; HPO32–, −7.7; S2O32–, −4.6; SO42–, −4.5; HOPO32–, −3.0; HOAsO32–, no activation detected.7 These results highlight the cryptic function for the phosphodianion-binding site of OMPDC, which provides Gibbs binding free energy to stabilize the Michaelis complex, while serving the more significant role of a dianion activation site. In this paper we examine the specificity of the dianion activation sites at ScTIM and hlGPDH, respectively, for activation of proton transfer and hydride transfer by a series of structurally homologous oxydianions. These new data allow a comparison of the kinetic parameters for activation of ScTIM, hlGPDH and ScOMPDC by five oxydianions: HPO32–, FPO32, S2O32–, SO42– and HOPO32–. Our results reveal a striking similarity in the specificity of these enzymes for dianion activation, which is consistent with a similar architecture for the three dianion binding sites.
Experimental Section
Materials
Water was from a Milli-Q Academic purification system. Bovine serum albumin, fraction V (BSA) was purchased from Roche. DEAE-Sepharose and Sephacryl S-200 were purchased from GE Healthcare. DEAE-Sephadex A25, Dowex 50WX4–200R, NADH (disodium salt), NAD+ (free acid), glycolaldehyde dimer, triethylamine (≥99.5%), triethanolamine hydrochloride and D,L-dithiothreitol (DTT) were purchased from Sigma-Aldrich. Protease inhibitor tablets (Complete) were purchased from Roche. Ammonium sulfate (enzyme grade), sodium bicarbonate, sodium hydroxide (1.0 N) and hydrochloric acid (1.0 N) were purchased from Fisher. Sodium phosphite (dibasic, pentahydrate) was purchased from Fluka. The water content was reduced to Na2HPO3·0.4H2O as previously described.12 Glycolaldehyde labeled with 13C at carbon-1 ([1-13C]-GA, 99% enrichment of 13C, 0.09 M in water) was purchased from Omicron Biochemicals. Deuterium oxide (99% D) and deuterium chloride (35% w/w, 99.9% D) were purchased from Cambridge Isotope Laboratories. Imidazole was recrystallized from benzene. Deuterium oxide (99.9% D) and deuterium chloride (35% w/w, 99.9% D) were from Cambridge Isotope Laboratories. Orotidine 5′-monophosphate (OMP) was synthesized enzymatically from 5-phosphoribosyl-1-pyrophosphate and orotic acid,37 and 1-(β-d-erythrofuranosyl)orotic acid (EO) was available from an earlier study.10 All other chemicals were reagent grade or better and were used without further purification.
A stock solution of unlabeled glycolaldehyde dimer (200 mM monomer) used for studies on GPDH was prepared by dissolving the dimer in water and storing the solution for at least 3 days at room temperature to allow for breakdown to the monomer.12 A solution of labeled [1-13C]-glycolaldehyde (1 mL of a 90 mM solution in H2O) used for studies on ScTIM was reduced to a volume of ca. 100 μL by rotary evaporation, 5 mL of D2O was added, and the volume was again reduced to ca. 100 μL by rotary evaporation. This procedure was repeated twice more and ca. 900 μL of D2O was added to the final solution to give a volume of ca. 1 mL. The stock solution of [1-13C]-GA in D2O was stored at room temperature to minimize the content of glycolaldehyde dimer,12 and the concentration of [1-13C]-GA was determined by 1H NMR spectroscopy.11 The barium salt of d-glyceraldehyde 3-phosphate diethyl acetal was prepared by a literature procedure.38 The solutions in D2O used for studies of the ScTIM-catalyzed reactions of [1-13C]-GA were prepared as described in earlier work.11
Enzymes
The C155S mutant of OMPDC from Saccharomyces cerevisiae (ScOMPDC) was prepared according to a literature procedure and stored at −80 °C.39,40 The enzyme was defrosted and dialyzed at 4 °C against 10 mM MOPS (50% free base) at pH 7.1 containing 100 mM NaCl, unless noted otherwise. Wildtype TIM from Saccharomyces cerevisiae (ScTIM) was expressed from the TIM-deficient tpiA– λDE3 lysogenic strain of Escherichia coli, purified by a literature procedure, and stored at −80 °C in 25 mM Tris-HCl at pH 8.0 and I = 0.1 (NaCl) containing 20% glycerol.5
The plasmid pDNR-dual donor vector containing the gene for wild-type human liver GPDH (hlGPDH) gene insert was purchased from the Harvard plasmid repository. The insert gene was subcloned into a bacterial expression vector pET-15b from Novagen and used for transformations of cells from E. coli strain Bl 21(DE3). These cells were then grown overnight in 200–300 mL of LB medium that contained 100 μg/mL ampicillin at 37 °C. This culture was diluted into 4 L of LB medium (100 μg/mL ampicillin), and grown at 37 °C to OD600 = 0.6, at which point 0.6 mM isopropyl-1-thio-d-galactoside was added to the culture to induce protein expression. After 12 h of overexpression, the cells were harvested and stored in 20 mL of 25 mM Tris-HCl buffer that contains 0.5 M NaCl at pH 7.9.
The cell pellets were suspended in 25 mM Tris-HCl at pH 7.9 in the presence of protease inhibitors (Complete) and lysed using a French press. The lysate was diluted to 40 mL with the same buffer and centrifuged at 13 000 rpm for 60 min. Solid ammonium sulfate was added to the lysate supernatant to give a 30% saturated solution, which was then centrifuged at 14 000 rpm for 20 min. The supernatant was mixed with solid ammonium sulfate to give a 40% saturated solution. After 20 min the mixture was centrifuged at 14 000 rpm for 20 min and the solid was dissolved in 25 mL of 25 mM Tris-HCl buffer at pH 7.9. The protein solution was dialyzed overnight against 25 mM Tris buffer pH 7.9 at 4 °C. The dialysate was loaded onto a DEAE-Sepharose ion-exchange column previously equilibrated against 25 mM Tris-HCl at pH 7.9. The column was eluted with 800 mL of a linear 0–150 mM gradient of NaCl in the same buffer. The protein concentration was determined from the UV absorbance at 280 nm, using the extinction coefficient of 18 450 M–1cm–1 calculated for a subunit molecular weight of 37 500 Da using the ProtParam tool available on the Expasy server.41,42 The fractions that contained GPDH were pooled, concentrated, and further purified over a Sephacryl S-200 column, equilibrated with 25 mM Tris pH 7.9 that contains 0.15 M NaCl; and, eluting with the same buffer solution. The GPDH obtained from this column was judged to be homogeneous by gel electrophoresis. Fractions with OD280 > 1 were pooled, concentrated and stored at −80 °C in 20% glycerol, 25 mM Tris-HCl buffer at pH 7.9, and 100 mM NaCl. The final yield of GPDH from a 2 L bacterial culture was typically 100 mg.
1H NMR Analyses
1H NMR spectra at 500 MHz were recorded in D2O at 25 °C using a Varian Unity Inova 500 spectrometer that was shimmed to give a line width of ≤0.5 Hz for the most downfield peak of the double triplet due to the C-1 proton of the hydrate of [1-13C]-GA.11 Spectra (16–64 transients) were obtained using a sweep width of 6000 Hz, a pulse angle of 90° and an acquisition time of 6 s. A total relaxation delay of 120 s (>8T1) between transients was used to ensure that accurate integrals were obtained for the protons of interest.43,44 Baselines were subjected to a first-order drift correction before determination of integrated peak areas. Chemical shifts are reported relative to that for HOD at 4.67 ppm.
Enzyme Assays
The TIM-catalyzed isomerization of GAP was monitored by coupling the formation of the DHAP to the oxidation of NADH catalyzed by GPDH.11,45 The standard assay mixture (1.0 mL) contained 100 mM triethanolamine buffer (pH 7.5, I = 0.1), 0.1 mg/mL BSA, 0.2 mM NADH, 2 mM GAP, 1 unit of GPDH and 0.01–0.05 nM ScTIM at I = 0.10 (NaCl). The decarboxylation of OMP catalyzed by OMPDC was monitored by following the decrease in absorbance at 279 nm.10,15 The assay solution (1 mL) contained OMP (≈0.05 mM) at pH 7.1 (30 mM MOPS), 25 °C and I = 0.10 maintained with NaCl.
GPDH was assayed by monitoring the oxidation of NADH by DHAP.45 The standard assay mixture contained 100 mM triethanolamine (pH 7.5), 1 mM DHAP, 0.20 mM NADH, 0.1 mg/mL BSA, 50 μM DTT, and ca. 0.67 nM GPDH at I = 0.12 (NaCl). The kinetic parameters kcat and Km for the GPDH-catalyzed reaction of DHAP at saturating 0.20 mM NADH was determined from the fit of kinetic data to the Michaelis–Menten equation. The value of Ki for competitive inhibition of GPDH-catalyzed reduction of DHAP by HPO32– at pH 7.5 and I = 0.12 (NaCl) was determined by examining the effect of increasing concentrations of DHAP (0.01–0.50 mM) on the initial velocity for reaction in the presence of 15 mM and 30 mM HPO32–.
Enzyme-Catalyzed Reactions of Phosphodianion Truncated Substrates
OMPDC
The decarboxylation of EO (0.1 mM) catalyzed by ScOMPDC [14 μM] in the presence of 2–40 mM FPO32– and 5 mM MOPS at pH 7.0, 25 °C and I = 0.14 (NaCl) was monitored at 283 nm.10,15 Reactions (1 mL total volume) were initiated by the addition of 50 μL of ScOMPDC in 100 mM MOPS (pH 7.0) and were monitored for up to 10 h. These reactions obeyed excellent first-order kinetics with stable end points at 10 reaction halftimes. Values of kobs (s–1) were obtained from the fits of the absorbance vs time trace to a single exponential decay. The apparent second-order rate constants (kcat/Km)obs (M–1 s–1) for ScOMPDC-catalyzed decarboxylation of EO were calculated using the relationship (kcat/Km)obs = kobs/[E].
ScTIM
The reactions of [1-13C]-GA in D2O catalyzed by wildtype ScTIM were monitored by 1H NMR spectroscopy, as described previously.11 The frozen enzyme was thawed and exhaustively dialyzed against 30 mM imidazole buffer (20% free base) in D2O at pD 7.0 and I = 0.024 (NaCl). The TIM-catalyzed reactions of [1-13C]-GA in the presence of dianion activators were initiated by the addition of enzyme to give reaction mixtures (850 μL in D2O) containing 20 mM [1-13C]-GA, 20 mM imidazole (20% free base), up to 30 mM dianion in D2O at pD 7.0 and I = 0.1 (NaCl). ScTIM was added to give the following range of final concentrations for the different dianion activators: 20–40 μM ScTIM, HPO32–; 30–100 μM ScTIM, FPO32; 80–240 μM ScTIM, SSO32–; 20–80 μM ScTIM, SO42–; 30–130 μM ScTIM, HPO42– In each case, 750 μL of the reaction mixture was transferred to an NMR tube, the 1H NMR spectrum was recorded immediately and spectra were then recorded at regular intervals. The remaining reaction mixture was incubated at 25 °C and was used to conduct periodic assays of the activity of TIM. No significant loss in TIM activity was observed during any of these reactions. These reactions were generally followed for ca. 30–40% reaction: 3–14 h, HPO32–; 5–12 h, FPO32–; 18–72 h, SO42–; and 15–80 h, HPO42–. The reactions in the presence of SSO32–were followed for ca. 40–60% reaction over 5–11 h. Once sufficient data had been obtained, the protein was removed by ultrafiltration and the solution pD was determined. There was no significant change in pD observed during any of these reactions.
These reactions were monitored by 1H NMR analyses, as described in previous work.11 Observed first-order rate constants for the disappearance of [1-13C]-GA, kobs (s–1) were determined from the slopes of linear semilogarithmic plots of reaction progress against time covering the first 30–60% of the reaction (eq 1), where fS is the fraction of [1-13C]-GA remaining at time t. The apparent second-order rate constants, (kcat/Km)obs (M–1 s–1), were calculated using eq 2, where fhyd = 0.94 is the fraction of [1-13C]-GA present in the unreactive hydrate form, and [E] is the concentration of ScTIM.12
| 1 |
| 2 |
hlGPDH
Stock solutions of hlGPDH (7 or 14 mg/mL) were dialyzed exhaustively against 20 mM triethanolamine at 4 °C. Assay mixtures for the hlGPDH-catalyzed reduction of GA in the absence of phosphite contained 10 mM TEA (pH 7.5), 20–60 mM GA, 0.20 mM NADH and 0.05 mM hlGPDH at I = 0.12 (NaCl). Assay mixtures for the hlGPDH-catalyzed reduction of GA in the presence of dianions contained 10 mM TEA (pH 7.5), 2–60 mM GA, 0.20 mM NADH, a measured concentration of the dianion at I = 0.12 (NaCl) and the following enzyme concentrations: 0.4 μM hlGPDH, HPO32–; 0.2 μM hlGPDH, FPO32–; 4 μM hlGPDH, SO42–; 4 μM hlGPDH, HOPO32–; 8 μM hlGPDH, S2O32–. The initial velocity of enzyme-catalyzed reduction of GA by NADH was determined by monitoring the decrease in absorbance at 340 nm over a period of 20 min for the dianion activated hydride transfer reactions, and a period of 120 min for the unactivated hydride transfer reactions. The kinetic parameters were determined from the nonlinear least-squares fits of kinetic data to the appropriate kinetic Scheme, using the fitting software provided by the Prism graphing program (GraphPad).
Results
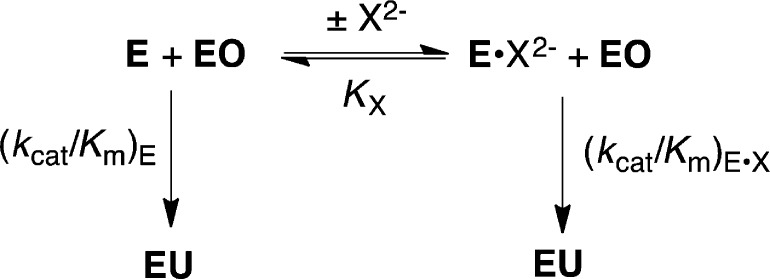
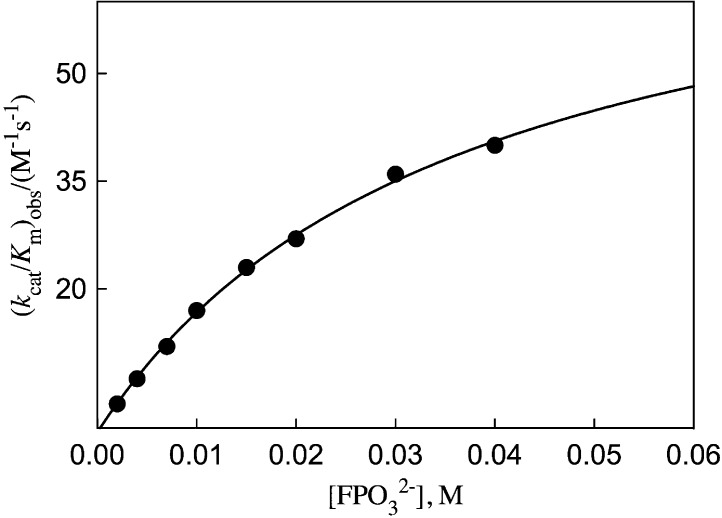
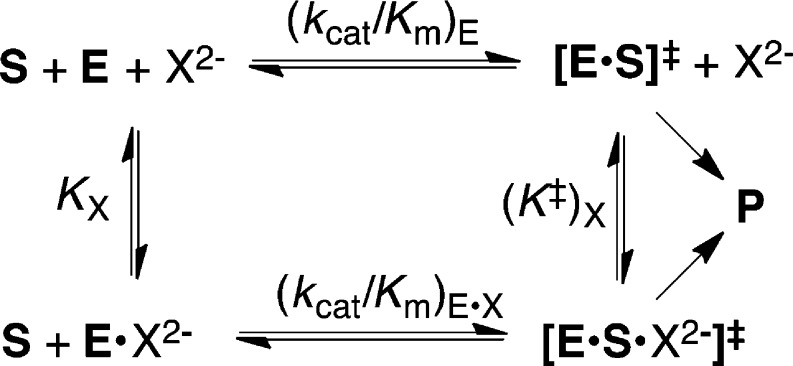
The decarboxylation of EO (0.10 mM) to form EU catalyzed by OMPDC in the presence of fluorophosphate dianion activator (Scheme 1) was monitored spectrophotometrically at 283 nm.7,10,15 Figure 2 shows the increase in the apparent second-order rate constants (kcat/Km)obs (M–1 s–1) for decarboxylation of EO at increasing [FPO32–]. The solid line shows the nonlinear least-squares fit of these data to eq 3 [X2– = FPO32–] derived for Scheme 1, using (kcat/Km)E = 0.026 M–1 s–1,46KX = 36 ± 2 mM and (kcat/Km)E·X = 77 ± 3 M–1 s–1.
 |
3 |
Scheme 1.
Figure 2.
Dependence of the apparent second-order rate constant (kcat/Km)obs for OMPDC-catalyzed turnover of EO on the concentration of FPO32–.
TIM-Catalyzed Reactions of [1-13C]-GA in D2O
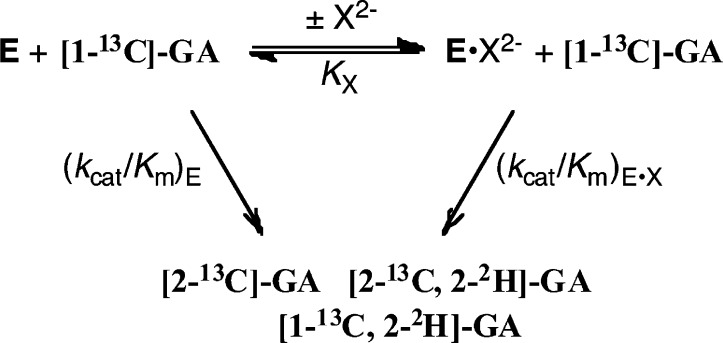
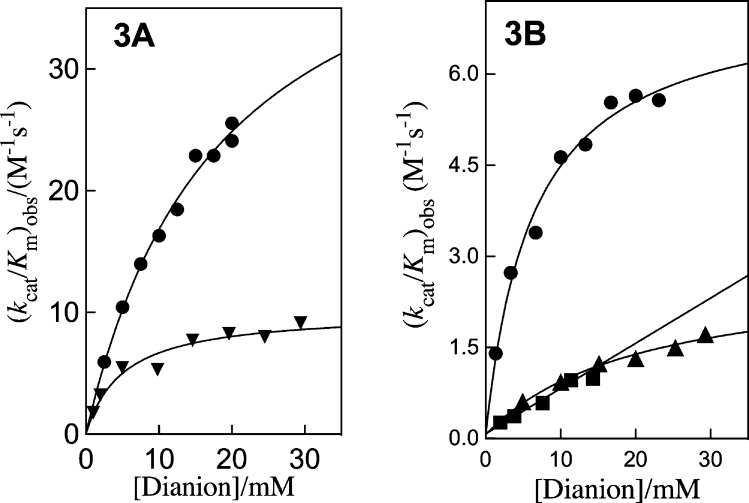
The disappearance of [1-13C]-GA (10 mM ≪ Km)12 and the formation of products [2-13C]-GA, [2-13C, 2-2H]-GA and [1-13C, 2-2H]-GA (Scheme 2) from reactions at the active site of wildtype ScTIM in D2O buffered by 20 mM imidazole at pD 7.0, °C, I = 0.1 (NaCl) and in the presence of dianion activators (Scheme 2) was monitored by 1H NMR spectroscopy as described in earlier work.8,11,47 Apparent second-order rate constants (kcat/Km)obs (M–1 s–1) for the ScTIM-catalyzed reactions were determined as described in the Experimental Section. Figure 3 shows the dependence of (kcat/Km)obs for ScTIM-catalyzed turnover of the carbonyl form of [1-13C]-GA in D2O, on the concentration of dianion activator for reactions at pD 7.0, 25 °C and I = 0.1, NaCl. These data were fit to eq 3 derived for Scheme 2, using (kcat/Km)E = 0.062 M–1 s–1 determined for the unactivated reaction, to give the values of KX and (kcat/Km)E·X reported in Table 1. The yields of [2-13C]-GA (22%), [2-13C, 2-2H]-GA (54%) and [1-13C, 2-2H]-GA (25%) obtained from reactions activated by HPO32– are similar to the yields determined in earlier work for the reactions of [1-13C]-GA catalyzed by TIM from chicken muscle (cTIM) and Trypanosoma brucei (TbbTIM).11,48 The small differences (not reported) in the yields of products from ScTIM-catalyzed reactions of [1-13C]-GA activated by different dianions show that dianions influence the partitioning of the enediolate reaction intermediate. These product yields will be reported in a separate publication.
Scheme 2.
Figure 3.
Dependence of (kcat/Km)obs for ScTIM-catalyzed turnover of the free carbonyl form of [1-13C]-GA in D2O on the concentration of added dianion for reactions at pD 7.0, 25 °C and I = 0.1, NaCl. The solid lines show the fits of the data to eq 3 derived for Scheme 2: (A) ●, HPO32–;▼, FPO32–. (B) ●, S2O32–; ▲, SO42–; ■, HOPO32–.
Table 1. Kinetic Parameters for Activation of ScTIM by Oxydianions (Scheme 2) and Derived Parameters for the Binding of Dianions to [E·S]‡ (Scheme 5)a.
| dianion | (kcat/Km)E (M–1 s–1)b | KX (mM)c,d | (kcat/Km)E·X (M–1 s–1)c,e | (kcat/Km)E·X/KX (M–2 s–1) | (K‡)X (M)f | RT ln(K‡)X (kcal/mol)g |
|---|---|---|---|---|---|---|
| none | 0.062 | |||||
| HPO32– | 18 ± 3 | 48 ± 4 | 2700 | 2.3 × 10⁻⁵ | –6.3 | |
| FPO32– | 5.1 ± 1.3 | 10 ± 0.7 | 2000 | 3.1 × 10⁻⁵ | –6.1 | |
| HOPO32– | n.dh | n.dh | 70 ± 10i | 8.8 × 10⁻⁴ | –4.2 | |
| SO42– | 21 ± 4 | 2.8 ± 0.3 | 130 | 4.7 × 10⁻⁴ | –4.5 | |
| S2O32– | 7 ± 1.0 | 7.3 ± 0.3 | 1200 | 5.2 × 10⁻⁵ | –5.8 |
Reactions of 20 mM [1-13C]-GA in D2O at pD 7.0 (20 mM imidazole), 25 °C and I = 0.1 (NaCl). The quoted uncertainty in the kinetic parameters is the standard error determined for the nonlinear least-squares fits of these data.
Second-order rate constant for the ScTIM-catalyzed reaction of [1-13C]-GA determined for a reaction in the absence of dianion activator.
Dissociation constant for release of the oxydianion from ScTIM.
Second-order rate constant for the reactions of [1-13C]-GA catalyzed by the enzyme–oxydianion complex (Scheme 2).
Dissociation constant for release of the oxydianion from the transition state complex, calculated using eq 6, derived for Scheme 5.
Intrinsic Gibbs dianion binding free energy.
Not determined: the plot for activation by HOPO32– (Figure 3) is linear through [HOPO32–] = 14 mM.
The slope of the linear correlation from Figure 3.
hlGPDH-Catalyzed Reduction of GA
GPDH from rabbit muscle follows an ordered mechanism, with NADH binding first followed by DHAP.49 Initial velocities, vi, of the reduction of DHAP by NADH catalyzed by hlGPDH at pH 7.5 (10 mM TEA), 25 °C and I = 0.12 (NaCl) were determined by monitoring the decrease in absorbance at 340 nm. The essentially identical Michaelis–Menten plots (not shown) of vi/[E] (s–1) against [DHAP] (carbonyl form) observed when [NADH] is held constant at 0.10 mM or 0.20 mM require Km ≪ 0.10 mM for NADH. The fit of data to the Michaelis–Menten equation gave (Km)obs = 0.052 mM for DHAP (carbonyl form, fcar = 0.45),50 when GPDH is saturated by NADH, kcat = 240 s–1 for turnover of the ternary E·NADH·DHAP complex and kcat/Km = 4.6 × 10⁶ M–1 s–1. These kinetic parameters are similar to kcat = 130 s–1, Km = 0.13 mM and kcat/Km = 1.0 × 10⁶ M–1 s–1 reported in an earlier study of GPDH from rabbit muscle.16 Phosphite dianion inhibition of hlGPDH-catalyzed reduction of DHAP by NADH was examined by determining initial velocities, vi, at seven different [DHAP] between 0.01 and 0.50 mM for reactions in the presence of constant 15 mM and 30 mM [HPO32–]. A value of Ki = 42 ± 6 mM was determined from the nonlinear least-squares fits of the kinetic data to eq 4, for competitive inhibition by HPO32–.
| 4 |
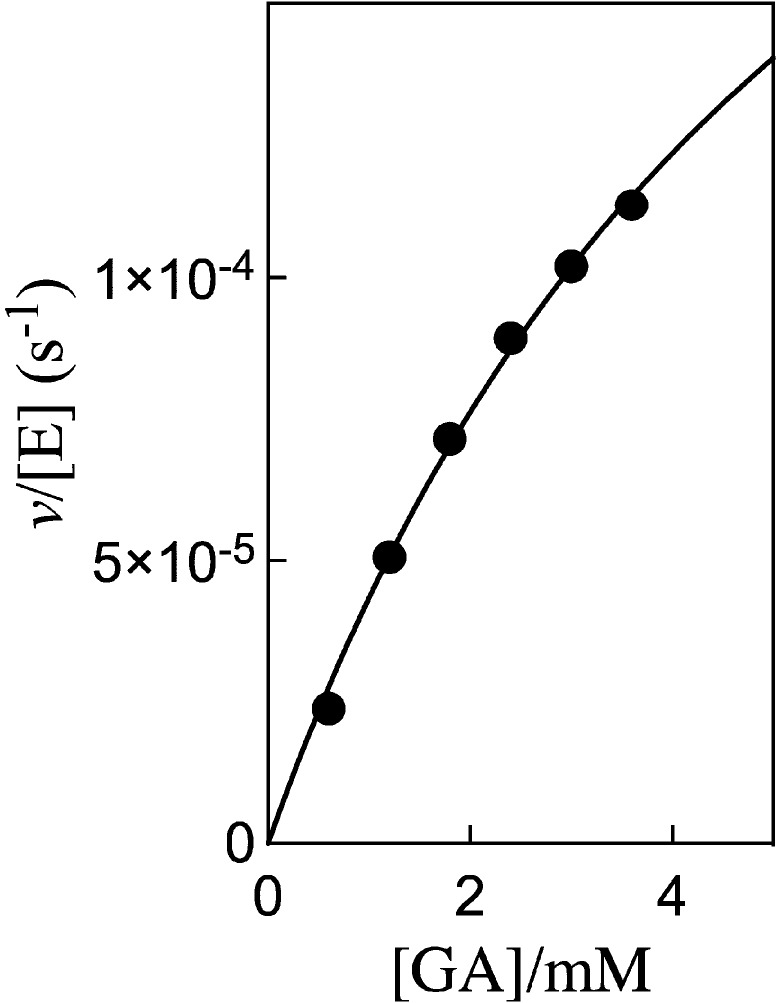
Initial velocities, vi, for the reduction of GA by NADH (0.2 mM) catalyzed by hlGPDH at pH 7.5 (10 mM TEA), 25 °C and I = 0.12 (NaCl) in the absence and the presence of dianion activators were determined by monitoring the decrease in absorbance at 340 nm. Figure 4 shows the dependence of vi/[E] (s–1) on the concentration of the reactive carbonyl form of GA (fcar = 0.06)12 for the unactivated reduction of GA by NADH catalyzed by 0.05 mM hlGPDH. The fit of these data to the Michaelis–Menten equation gave values of KGA = 6.2 mM, kcat = 3.1 × 10⁻⁴ s–1, and kcat/KGA = 0.05 M–1 s–1.
Figure 4.
Dependence of vi/[E] (s–1) on the concentration of glycolaldehyde (GA), for the reduction by NADH (0.2 mM) catalyzed by hlGPDH at pH 7.5 (10 mM TEA), 25 °C and I = 0.12 (NaCl).
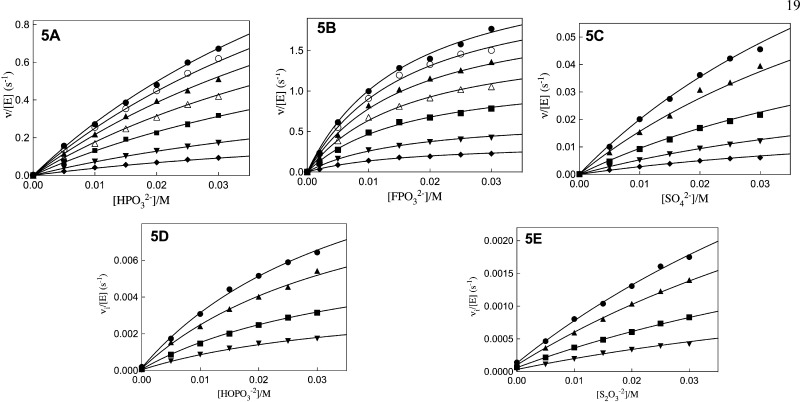
Figure 5A shows the dependence of vi/[E] (s–1) on [HPO32–] for the reduction of GA by NADH (saturating) catalyzed by hlGPDH, for reactions carried out at different fixed concentrations of GA. The solid lines show the nonlinear least-squares fit of these data to eq 5, derived for Scheme 3, using the appropriate kinetic parameters reported in Table 2. The value of (kcat/Km)E·X/KX = 16 000 M–2 s–1 determined for phosphite dianion activation of human liver hlGPDH catalyzed reduction of GA is 4-fold larger than (kcat/Km)E·X/KX = 4300 M–2 s–1 reported in an earlier study on for rabbit muscle GPDH.16 Human liver hlGPDH shows a similar 4-fold larger value of kcat/Km = 4.6 × 10⁶ M–1 s–1 for catalysis of reduction of DHAP at saturating [NADH], compared with kcat/Km = 1.0 × 10⁶ M–1 s–1 for rabbit muscle GPDH.16 Figure 5B–D show, respectively, kinetic data determined under the same reaction conditions for activation of hlGPDH-catalyzed reduction of GA by fluorophosphate, sulfate, phosphate and thiosulfate dianion. The solid lines show the nonlinear least-squares fit of the data to eq 5, using the kinetic parameters reported in Table 2.
| 5 |
Figure 5.
Dependence of vi/[E] (s–1) for the reduction of GA by NADH (0.2 mM) catalyzed by hlGPDH at pH 7.5 (10 mM TEA), 25 °C and I = 0.12 (NaCl) at increasing concentrations of dianion for reactions at different fixed concentrations of GA. Key: (A) HPO32–: (●), 3.6 mM GA; (○); 3.0 mM; (▲), 2.4 mM; (Δ), 1.8 mM; (■), 1.2 mM; (▼), 0.6 mM; (◆); 0.3 mM. (B) FPO32–: (●), 3.6 mM GA; (○); 3.0 mM; (▲), 2.4 mM; (Δ), 1.8 mM; (■), 1.2 mM; (▼), 0.6 mM; (◆); 0.3 mM. (C) SO42–: (●), 3.6 mM GA; (▲), 2.4 mM ; (■), 1.2 mM; (▼), 0.6 mM; (◆); 0.3 mM. (D) HPO42–: (●), 3.6 mM GA; (▲), 2.4 mM ; (■), 1.2 mM; (▼), 0.6 mM. (E) S2O32–: (●), 3.6 mM GA; (▲), 2.4 mM ; (■), 1.2 mM; (▼), 0.6 mM.
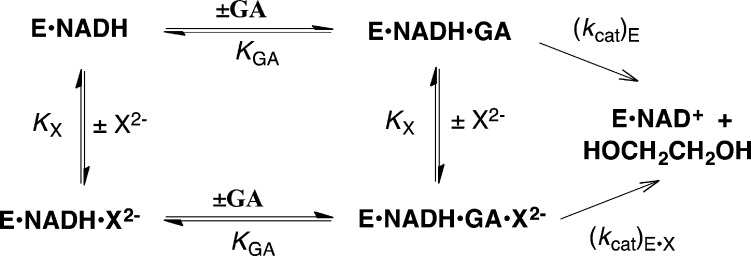
Scheme 3.
Table 2. Kinetic Parameters for Activation of hlGPDH by Oxydianions (Scheme 3) and Derived Parameters for the Binding of Dianions to [E·S]‡ (Scheme 5)a.
| dianion | (kcat)E·X (s–1)b | KGA (mM)c | KX (mM)d | (kcat/Km)E·X/KX (M–2 s–1) | (K‡)X (M)e | RT ln(K‡)X (kcal/mol)f |
|---|---|---|---|---|---|---|
| none | (3.1 ± 0.3) × 10–4 | 6.2 ± 1 | ||||
| HPO32– | 5.5 ± 0.3 | 4.9 ± 0.2 [8]g | 70 ± 4 | 16000 ± 1300 [4300 ± 700]g | 3.3 × 10⁻⁶ | –7.5 |
| FPO32– | 6.4 ± 0.25 | 5.0 ± 0.3 | 17 ± 1 | 75000 ± 6000 | 6.5 × 10⁻⁷ | –8.4 |
| HOPO32 | 0.032 ± 0.002 | 4.1 ± 0.2 | 40 ± 3 | 200 ± 20 | 2.5 × 10⁻⁴ | –4.9 |
| SO42– | 0.360 ± 0.040 | 4.5 ± 0.4 | 70 ± 9 | 1100 ± 200 | 4.6 × 10⁻⁵ | –5.9 |
| S2O32– | 0.0190 ± 0.002 | 5.0 ± 0.2 | 110 ± 10 | 35 ± 5 | 1.5 × 10⁻³ | –3.8 |
Reactions catalyzed by hlGPDH at pH 7.5 (10 mM TEA), 25 °C, 0.2 mM NADH, and I = 0.12 (NaCl). The quoted uncertainty in these kinetic parameters is the standard error determined for the nonlinear least-squares fits of these data.
First-order rate constant for turnover of the Michaelis complex to form product (Scheme 3).
Dissociation constant for release of GA from the binary or ternary enzyme complex (Scheme 3).
Dissociation constant for release of the oxydianion from the binary or ternary enzyme complex (Scheme 3).
Dissociation constant for release of the dianion from the transition state complex, calculated using eq 6, derived for Scheme 5.
Intrinsic Gibbs dianion binding free energy.
Kinetic parameter for GPDH from rabbit muscle.16
Discussion
We have reported kinetic parameters for activation of yeast OMPDC-catalyzed decarboxylation of EO (Figure 1) by SO32–, HPO32–, S2O32–, SO42– and HOPO32–.7 We did not examine activation of ScTIM and hlGPDH by SO32–, which is a strong sulfur nucleophile that will form an adduct to the carbonyl carbon of truncated substrate GA,51−53 and added instead fluorophosphate dianion (FPO32–) to our series of oxydianions activators. We examined HPO32– activation of rabbit muscle GPDH-catalyzed reduction of GA by NADH,16 but use human liver enzyme (hlGPDH) in this study. hlGPDH shows 4-fold larger values for kcat/Km and (kcat/Km)E·X/KX for the catalyzed reactions of DHAP and the pieces GA + HPO32–, respectively, compared with rabbit muscle GPDH.16 Linear plots of vi/[E] (s–1) against [HPO32–] were determined for rabbit muscle GPDH that are consistent with KX > 100 mM for HPO32– (Scheme 3).16 This is greater than KX = 70 mM determined for hlGPDH (Table 2).
The activation of hlGPDH-catalyzed reduction of GA by oxydianions (X2–) was studied at saturating [NADH] = 0.2 mM, and proceeds through the quaternary E·NADH·GA·X2– complex. The kinetic data were fit to Scheme 3, which neglects steps for release of NAD+ and binding of NADH. These steps are fast relative to kcat ≤ 10 s–1 (Table 2) for turnover of E·NADH·GA·X2–, because they support the even faster turnover of the ternary E·NADH·DHAP complex, for which kcat = 240 s–1. Scheme 3 shows a random order for binding of GA and X2– to E·NADH, and a single dissociation constant KGA or KX for release of the ligands from E·NADH·GA·X2– and from the corresponding E·NADH·GA or E·NADH·X2– complexes. The fits of kinetic data for activation by HPO32– to eq 5, derived for Scheme 3 (Figure 5A), give values of KGA = 4.9 mM and KX = 70 mM that are similar, respectively, to KGA = 6.2 mM for the hlGPDH-catalyzed reaction in the absence of activator (Figure 4) and KX = 42 mM for competitive inhibition by HPO32– of hlGPDH-catalyzed reduction of DHAP. These results show that the interactions between GA and X2– at the quaternary complex E·NADH·GA·X2– do not result in a large change in ligand affinity compared to the ternary E·NADH·X2– and E·NADH·GA complexes.
Reactivity of Enzyme-Bound Whole Substrates and the Substrate Pieces
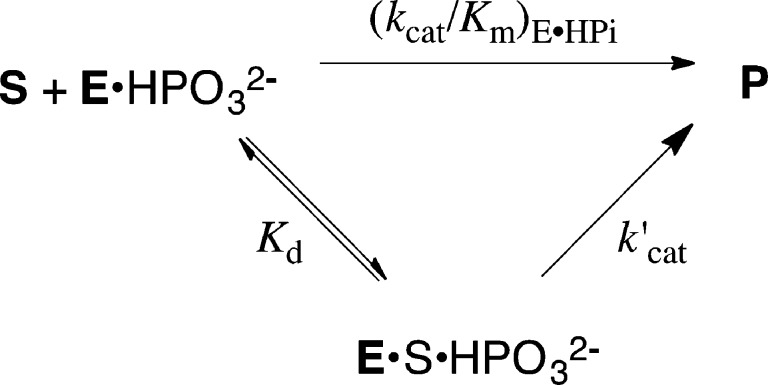
Enzyme activation by phosphite dianion for catalysis of the reactions of truncated substrate suggests similar turnover numbers for the reactions of enzyme-bound whole substrate and the corresponding substrate pieces. This is supported, at least in part, by data from Table 3 which compares kinetic parameters for the reactions of whole substrates catalyzed by ScOMPDC (OMP), ScTIM (GAP) and hlGPDH (DHAP), with kinetic parameters for the catalyzed reactions of substrate pieces. The turnover numbers k′cat for complexes of the substrate pieces (Scheme 4) were calculated from values (kcat/Km)E·HPi and Kd, using the relationship k′cat = [(kcat/Km)E·HPi]Kd. We do not report a value of (kcat)′ for the ScTIM-catalyzed reaction, because we are unable to approach saturation of this enzyme by GA.
Table 3. Rate Constants for Turnover of Whole Substrates and the Substrate Pieces Catalyzed by ScOMPDC, ScTIM and hlGPDHa.
| enzyme | kcat (s–1)b | (kcat/Km) (M–1 s–1)b | (kcat/Km)E (M–1 s–1)c | (kcat/Km)E·HPi (M–1 s–1)c | Kd (M)c | k′cat (s–1)d |
|---|---|---|---|---|---|---|
| ScOMPDCe | 16 | 1.1 × 10⁷ | 0.026 | 1600 | ≈ 0.1 | ≈ 160f |
| ScTIM | 8900g | 2.2 × 10⁸g | 0.062h | 48h | ||
| hlGPDH | 240i | 4.6 × 10⁶i | 0.050 | 1100j | 0.005 | 5.5 |
Enzyme-catalyzed reactions of the following whole substrates and substrate pieces: OMPDC; OMP and EO + HPO32–; ScTIM; GAP and GA + HPO32–; hlGPDH; DHAP and GA + HPO32–.
Kinetic parameters for turnover of the whole substrate.
Rate constant for turnover of the complex between the enzyme and substrate pieces (Scheme 4), estimated as k′cat = [(kcat/Km)E·HPi]Kd.
Published kinetic parameters.10
Calculated using (kcat/Km)E·HPi = 1600 M–1 s–1 and Kd ≈ 0.1 M.10
Kinetic parameters for ScTIM-catalyzed isomerization of GAP.54
Table 1.
Table 2.
Calculated from (kcat/Km)E·X/KX = 16000 M–2 and KX = 0.070 M (Table 2).
Scheme 4.
Table 3 shows that k′cat ≈ 160 s–1 for turnover of EO by OMPDC is significantly larger than kcat = 16 s–1 for turnover of OMP, as noted in earlier work.10 However, k′cat ≈ 5.5 s–1 for turnover of GA by hlGPDH is smaller than kcat = 240 s–1 for turnover of DHAP. It is interesting that the second order rate constants (kcat/Km)E·HPi for OMPDC (1600 M–1 s–1) and hlGPDH (1100 M–1 s–1) catalyzed reactions of their respective substrate pieces are similar, but that k′cat ≈ 160 s–1 for OMPDC is much larger than k′cat = 5.5 s–1 for GPDH-catalyzed turnover of the respective truncated substrates, because this requires a surprising 20-fold larger affinity of the minimal two-carbon substrate (Kd = 0.005 M) for the hlGPDH-catalyzed reaction compared with Kd = 0.1 M for the more functionalized substrate EO.
GA exists mainly as the hydrate (94%),50 and the interpretation of these data depends upon whether the nonproductive GPDH·hydrate complex accumulates. We suggest that Kd = 0.005 M for GA reflects mainly the formation of the nonproductive hydrate complex and that the observed kinetic parameter k′cat = 5.5 s–1 underestimates the turnover number for the [E·NADH·GA·HPi] complex because only a small fraction of GPDH exists as the productive complex to the carbonyl form of GA. Nonproductive binding would result in balancing decreases in Kd and k′cat (Scheme 4), compared to the values for the reactive carbonyl substrate. By contrast, the accumulation of a nonproductive hydrate complex does not affect (kcat/Km)E·HPi determined at low [GA], where the hlGPDH exists mainly in the unliganded form.55
Dianion Activation Binding Site
The ratios of the third-order rate constant (kcat/Km)E·X/KX for catalysis of the reaction of the substrate pieces and the second-order rate constant (kcat/Km)E for the truncated substrate (Table 3) range from 4.4 × 10⁵ M–1 for yeast OMPDC-catalyzed decarboxylation to 4.4 × 10⁴ M–1 for ScTIM-catalyzed isomerization and correspond to 7.7 and 6.3 kcal/mol intrinsic phosphite dianion binding energies (see below).
This shows that efficient catalysis by OMPDC, ScTIM and hlGPDH is achieved by combining a catalytic site that provides sufficient stabilization of the transition state for reaction of the truncated substrate to give (kcat/Km)E ≈ 0.05 M–1 s–1 and a dianion activation site that boosts enzyme activity toward perfection, by providing 11–13 kcal/mol transition state stabilization from the phosphodianion binding Gibb free energy.56
These large intrinsic dianion binding energies may be rationalized using representations of X-ray crystal structures shown in Figure 6.57−59 Two types of interactions are shown, which stabilize these enzyme–phosphodianion complexes. (i) An ionic interaction between the phosphodianion and a cationic side chain (Arg235 for OMPDC, Arg269 for GPDH and Lys12 for ScTIM). (ii) Networks of hydrogen bonds to either backbone amides, amide side chains, and in the case of ScOMPDC the phenol side chain of Tyr217.
Figure 6.
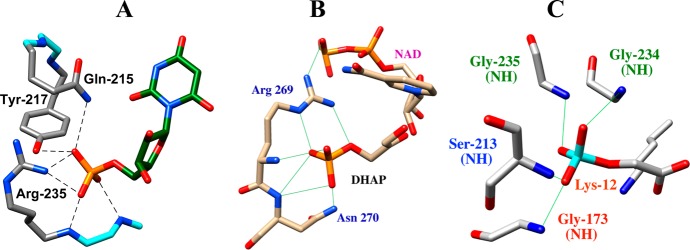
Representations of X-ray crystal structures of ScOMPDC, hlGPDH and ScTIM. (A) ScOMPDC in a complex with the intermediate analogue 6-hydroxyuridine 5′-monophosphate (PDB entry 1DQX).59 The interactions of Gln215, Tyr217 and Arg235 side chains and the Gly234 and Arg235 backbone amides with the ligand phosphodianion are shown. Reprinted with permission from ref (46). Copyright 2012 American Chemical Society. (B) A nonproductive ternary complex of human liver hlGPDH with DHAP and NAD (PDB entry 1WPQ).57 The interactions of Arg269 and Asn270 side chains and the Arg269 and Asn270 backbone amides with the ligand phosphodianion are shown. (C) ScTIM in a complex with the intermediate analogue 2-phosphoglycolate (PDB entry 2YPI).58 The interactions of the K12 side chain and the Gly173, Ser213, Gly234 and Gly 235 backbone amides are shown.
The effects of the K12G mutation of ScTIM (550 000 fold) and the R235A mutation (18 000-fold) of OMPDC on kcat/Km correspond to 7.8 and 5.8 kcal/mol stabilizing interactions between the protein side chain and the transition states for the respective enzyme-catalyzed reactions of GAP and OMP.54,60 The stronger transition state stabilization by Lys12 compared to Arg235 reflects the interaction of the former side chain with both the phosphodianion and the negatively charged enolate oxygen,54 compared with the essentially exclusive interaction of the side chain of Arg235 with the substrate phosphodianion.4,61 Each of the cationic side chains, which interact with substrate phosphodianion (Figure 6), sit on the protein surface and shield the phosphodianion from interaction with bulk solvent. This positioning enables effective rescue of the R235A and K12G mutants by transfer of exogenous guanidinium60 and alkylammonium cations,62 respectively, from water to the cleft at the protein created by the mutation. We suggest that the R269A mutation of hlGPDH will, likewise, result in a large falloff in catalytic activity, which will be rescued by exogenous guanidinium cation.
The effects of all combinations of single, double and triple Q215A, Y217F and R235A mutations on the kinetic parameters for ScOMPDC-catalyzed reactions of whole substrate and substrate pieces have been determined.4 The results show that the total 12-kcal/mol intrinsic Gibbs phosphodianion binding free energy for OMPDC (Table 3) is equal to the sum of the phosphodianion binding energies of the side chains of R235 (6 kcal/mol), Q215 (2 kcal/mol) Y217 (2 kcal/mol) and hydrogen bonds to the G234 and R235 backbone amides (2 kcal/mol). We have not quantified the contribution of interactions between the substrate phosphodianion and the backbone amides of TIM to the intrinsic phosphodianion binding energy. However, stabilizing interactions of ca. 1–2 kcal/mol/amide, along with the 7.8 kcal/mol interaction of K12, would be sufficient to account for the 13 kcal/mol dianion binding energy.
Specificity in the Binding of Oxydianions
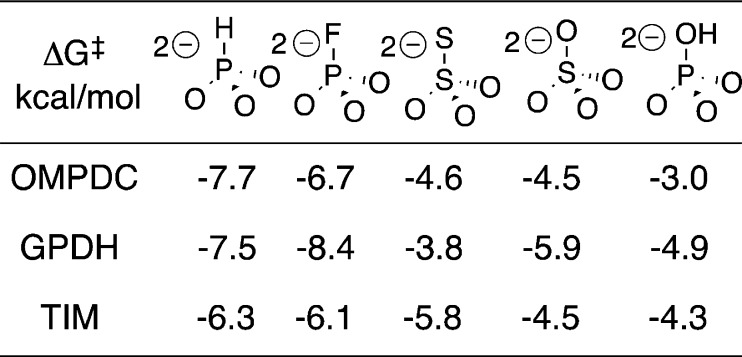
Values of (K‡)X for breakdown of oxydianion complexes to the transition states for ScOMPDC-, ScTIM- and hlGPDH-catalyzed reactions ([E·S·X2–]‡) were determined using eq 6 derived for Scheme 5. The transition state binding energies ΔG‡ were calculated as ΔG‡ = RT ln(K‡)X and are summarized in Chart 1. The intrinsic Gibbs phosphodianion binding free energy for ScTIM (13.0 kcal/mol, Table 3) is larger than for ScOMPDC (11.7 kcal/mol) or hlGPDH (10.7 kcal/mol). By contrast, the intrinsic phosphite dianion binding energy (Chart 1) for ScTIM (−6.3 kcal/mol) is smaller than for OMPDC (−7.7 kcal/mol) or hlGPDH (−7.5 kcal), so that the latter two enzymes show the broader range of dianion binding energies: 3.0–7.7 kcal/mol for ScOMPDC and 3.8–8.4 kcal/mol for hlGPDH, compared with 4.3–6.3 kcal/mol for ScTIM (Chart 1). These differences reflect the larger connection energy (ΔGS)27 arising from the covalent attachment of the pieces bound to ScTIM (ΔGS = 13.0–6.3 = 6.7 kcal/mol) compared with ScOMPDC (ΔGS = 11.7–7.7 = 4.0 kcal/mol) or hlGPDH (ΔGS = 10.7–7.5 = 3.2 kcal/mol). This observation that decreases in the total dianion binding energy are accompanied by increases in the total phosphite dianion binding energy suggests that the total dianion binding energy might be sacrificed to optimize the activating dianion interactions. For example, destabilizing steric interactions between the enzyme and the phosphodianion of the whole substrate at a restricted binding pocket, which are expressed in substrate binding (Km) but not dianion activation (kcat), might be smaller or absent at the enzyme complex to phosphite dianion and the truncated substrate pieces.
Scheme 5.
Chart 1.
There is no obvious correlation between oxydianion structure and dissociation constants KX for release of oxydianions from OMPDC, TIM and GPDH. By contrast, the strong enzyme activation by oxydianions requires a high specificity for their binding to the activated complexes [E·S]‡ [(K‡)X ≪ KX, Scheme 5]. We note the following trends in the values of ΔG‡ for binding of oxydianions to the respective [E·S]‡ complexes for reactions catalyzed by ScOMPDC, hlGPDH and ScTIM.
(1) The largest oxydianion binding energies are observed when two negative charges are delocalized over the three oxygen of HPO32– or FPO32–. The delocalization of negative charge onto the fourth heteroatom of SO42– and S2O32– results in a reduction in the Gibbs oxydianion binding free energy for ScOMPDC-, hlGPDH- and ScTIM-catalyzed reactions (Chart 1). The difference between the −5.8 and −4.5 kcal dianion binding energy of S2O32– and SO42– observed for TIM may reflect the small delocalization of charge onto the peripheral sulfur of S2O32–, which results in a larger negative charge density at the three oxygen.63 The generally smaller dianion binding energy for HOPO32– compared with FPO32− may reflect differences in the steric and electronic properties of −OH and −F.
| 6 |
(2) There are no interactions between ScOMPDC (Figure 6A) or ScTIM (Figure 6C) and the bridging phosphate oxygen of the enzyme-bound ligand, but the bridging phosphate oxygen of DHAP bound to hlGPDH forms a hydrogen bond to the cationic side chain of Arg-269 (Figure 6B). We therefore propose that the unusually large −8.4 kcal/mol and small −3.8 kcal/mol Gibbs intrinsic dianion binding free energy, respectively, for activation of hlGPDH by FPO32– and S2O32– (Chart 1) compared with activation of ScTIM and hlGPDH is due to stabilizing electrostatic interactions between the side chain of Arg-269 and -F of FPO32– and destabilizing steric/electrostatic interactions between this side chain and an −S of S2O32–, where -F and -S are bound at a position equivalent to that for the bridging phosphate oxygen of DHAP.
Mechanism for Enzyme Activation
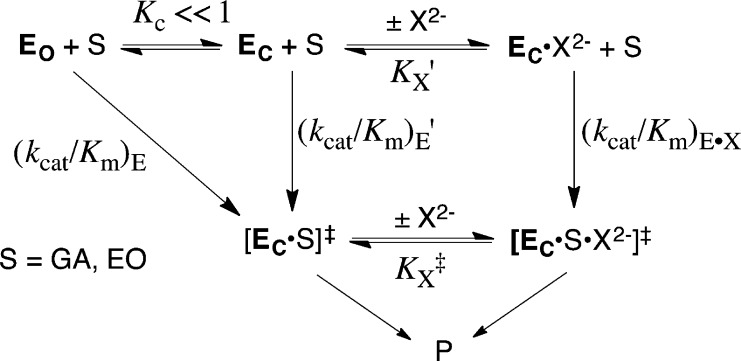
Scheme 6 provides a rationalization for phosphite dianion activation of TIM, OMPDC and GPDH for catalysis of reactions of the respective truncated substrates. These enzymes exist mainly in an open resting form (EO), and undergo a dianion-driven conformational change to a closed form (EC), which includes closure of a loop over the dianion. We have proposed that this conformational change is thermodynamically unfavorable (KC ≪ 1).4−7,11,24,25,46,47,61,64,65 Part or all of energetic cost for the enzyme conformational change is paid in the Gibbs binding free energy of the first piece, either S‡ or X2–, as shown in Figure 7. A larger ligand binding energy and specificity is then expressed as tight binding of the second piece to the respective binary complexes; either the binding of S‡ to EC·X2– or of X2– to [EC·S]‡ to form the ternary [EC·S·X2–]‡ complex (Figure 7). The small dependence of KX on dianion structure (Tables 1, 2 and ref (7)) suggests that the specific enzyme–dianion interactions only develop at the EC·X2– complex, and that the complexes of most or all oxydianions to the free enzymes are nonproductive and exist mainly in the open (EO·X2–) form.
Scheme 6.
Figure 7.
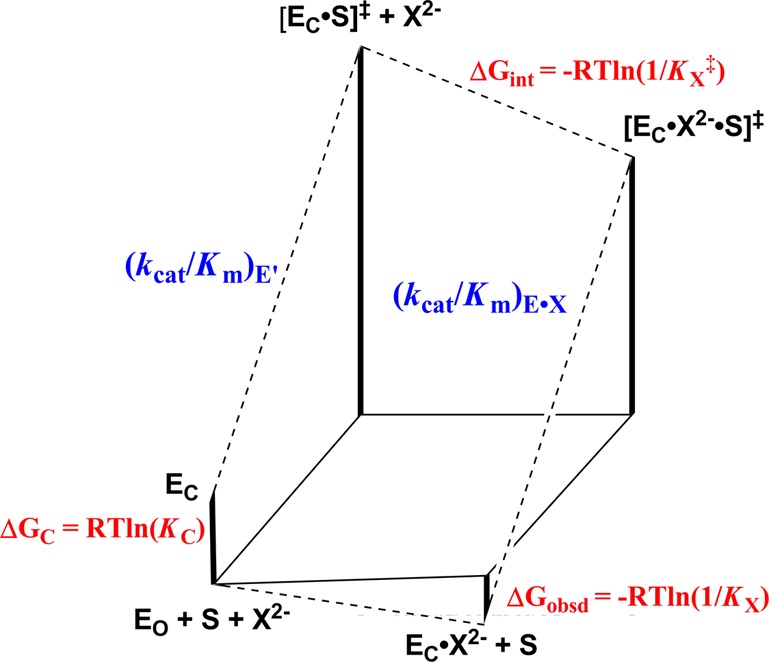
Gibbs free energy diagram that shows enzyme-catalyzed turnover of truncated substrate S by EO, and by an enzyme–oxydianion complex (EC·X2–). The tighter binding of the oxydianion to the transition state complex [EC·S]‡ to give [EC·X2–·S‡] [ΔGint = −RT ln(1/Kx‡)] compared to the free enzyme EO to give EC·X2– [ΔGobs = −RT ln(1/Kx)] is attributed to ΔGC = −RT ln(KC) for the unfavorable conformational change that converts inactive open EO to active closed EC. The binding energy of oxydianions is utilized to reduce, or eliminate entirely, the barrier to ΔGC for the enzyme conformational change.
A Role for Ligand Induced Fits in Enzyme Catalysis
Scheme 6 and Figure 7 for catalysis by ScTIM, ScOMPDC, hlGPDH, and other enzymes that are activated by dianions, show two conformations: dominant inactive open EO and a proposed high Gibbs free energy EC, whose formation is induced by binding of either an oxydianion, or the transition state for the enzymatic reaction.4−7,11,24,25,46,47,61,64−66 This Scheme and Figure are representations of Koshland’s proposal that enzymes exist in an inactive resting form, where the catalytic side chains are poorly positioned to carry out their assigned functions. The ligand binding energy is then utilized to induce a large change in enzyme structure, which shifts these active site residues to their catalytically active positions.28,29
The many cases for which substrate Gibbs binding free energy is utilized to induce an optimal substrate fit at enzyme active sites confirm Koshland’s induced fit model. However, the significance of the term “induced fit” has been reduced and its use in the biochemical literature limited, by the lack of a generally accepted description of the imperatives for catalysis by enzymes that exist mainly in an inactive open form and which rely upon the substrate binding energy to drive extensive changes in enzyme structure.56,67 Why not the alternative, where the enzyme folds into its active conformation and the intrinsic substrate binding energy is used for other purposes?56,67 We propose the following imperatives for the utilization of substrate binding energy to drive thermodynamically unfavorable changes in enzyme conformation.
(1) Wolfenden noted that substrate binding will necessarily only occur to a solvent exposed active site, while a caged Michaelis complex may provide for a larger number of enzyme–ligand interactions.68 This provides a rational for conformational changes that create a caged complex, after initial substrate binding to the open forms of TIM, OMPDC and GPDH.6
(2) Removal of solvent from an exposed cavity during loop closure promotes effective catalysis of polar reactions.6,69 The energetic cost for desolvation of enzyme active sites is included in the total cost of the enzyme conformational change, and may be paid for by the utilization of Gibbs dianion binding free energy.24 Closure of the flexible phosphodianion gripper loop 6 of TIM from Trypanosoma brucei brucei (TbbTIM) over the bound substrate extrudes several water molecules to the bulk solvent,70,71 sandwiches the carboxylate anion side chain of Glu-167 (the active site base for TIM) between the hydrophobic side-chains of Ile-172 and Leu-232,72 and shields the carboxylate anion from interactions with the aqueous solvent. Loosening this hydrophobic clamp by the I172A mutation of TbbTIM results in a 100-fold falloff in kcat/Km for isomerization of GAP47 and a ≈2 unit decrease in the pKa for the catalytic side chain at the enzyme–phosphoglycolate complex.73 These results are consistent with the proposal that the hydrophobic side chain of Ile-172 plays a role in effecting a strong basicity for the side chain that acts as the Brønsted base to deprotonate the bound carbon acid.73,74
(3) There is an unclear entropic cost, paid for by the utilization of Gibbs dianion binding free energy, to freezing motions of flexible enzyme loops and of active site catalytic side chains as the protein conformation changes from inactive EO to active EC.
(4) Relatively large barriers to enzyme conformational changes may exist simply to avoid the expression of Gibbs dianion binding free energy at the Michaelis complex and the resulting effectively irreversible ligand binding.56 The barrier to this unfavorable conformational change would not be strongly expressed in the total activation barrier for the reaction under kcat/Km conditions, so long as kcat/Km is close to the diffusion-controlled limit for a “perfect” enzyme and conversion of the first-formed EO·S complex to the active EC·S complex and then to product is faster than dissociation of S from EO·S.65 In such cases, changes in KC for the enzyme conformational change will result in compensating changes in kcat and Km, but little or no change in kcat/Km.
We previously reported that the L232A mutation of TbbTIM results in a 17-fold increase in the second-order rate constant (kcat/Km)E for TIM-catalyzed proton transfer reactions of the truncated substrate piece [1-13C]-GA in D2O (Scheme 2).65 We have proposed that the hydrophobic side chain of L232 functions to cause an increase the barrier to the protein conformational change ΔGC (Figure 7), that reduces the substrate binding energy expressed at the Michaelis complex.47,65 The L232A mutation then results in an increase in the fraction of enzyme present in the active closed form (increase in ΔGC), and in similar increases in the values of kinetic parameters that depend upon the magnitude of ΔGC: (kcat/Km)E, KX and (kcat/Km)E·X/KX (Figure 7)47,65
The Role of Conformational Changes in Enzyme Catalysis
There are good reasons to refer to enzyme structures as plastic, in recognition of the large changes in structure observed during the catalytic cycle.9,75−78 There is an ongoing debate about the role of these conformational changes in catalysis.79 On the one hand, protein motions may be coupled to motion along the reaction coordinate, and might even contribute to the catalytic rate acceleration by promoting formation of the transition state.80−83 However, a strong case can be made that effective enzymatic catalysis is due to the preorganization of catalytic side chains into their catalytically active conformations, which optimizes their stabilizing interactions with the transition state.69,84,85 The far from definitive experimental evidence offered in support of the coupling of protein motions to catalysis has been criticized.86 Our model to rationalize oxydianion activation of the reactions catalyzed by TIM, OMPDC and GPDH emphasizes the large barrier to the conformational changes, which convert the inactive open enzyme to the active closed form: a part of this barrier represents the requirement for organization of the catalytic side chains at a caged active site complex. We do not exclude the possibility that enzyme–dianion interactions are first utilized to lock the Michaelis complex in the active conformation EC, and that this is followed by coupled motions of the protein and substrate on proceeding to the transition state. However, this added layer of complexity is not required to rationalize our experimental data. An examination of Figure 6 and related structures for enzyme–ligand complexes emphasize the enormity of the possible stabilizing interactions between enzymes and transition states. We suggest that the formal contribution to catalysis (if any) of coupling protein and reaction coordinate motions is of incidental importance compared to the large transition state stabilization obtained from strong protein–ligand interactions.
Acknowledgments
We acknowledge the National Institutes of Health Grant GM39754 for generous support of this work. We thank Prof. Steve Withers for the suggestion to examine a fluorophosphate dianion activator.
The authors declare no competing financial interest.
Funding Statement
National Institutes of Health, United States
References
- Herschlag D.; Natarajan A. Biochemistry 2013, 52, 2050–2067. [DOI] [PMC free article] [PubMed] [Google Scholar]
- Fersht A. R. Biochemistry 1988, 27, 1577–1580. [DOI] [PubMed] [Google Scholar]
- Fersht A. R. Biochemistry 1987, 26, 8031–8037. [DOI] [PubMed] [Google Scholar]
- Goldman L. M.; Amyes T. L.; Goryanova B.; Gerlt J. A.; Richard J. P. J. Am. Chem. Soc. 2014, 136, 10156–10165. [DOI] [PMC free article] [PubMed] [Google Scholar]
- Zhai X.; Amyes T. L.; Richard J. P. J. Am. Chem. Soc. 2014, 136, 4145–4148. [DOI] [PMC free article] [PubMed] [Google Scholar]
- Richard J. P.; Amyes T. L.; Goryanova B.; Zhai X. Curr. Opin. Chem. Biol. 2014, 21, 1–10. [DOI] [PMC free article] [PubMed] [Google Scholar]
- Spong K.; Amyes T. L.; Richard J. P. J. Am. Chem. Soc. 2013, 135, 18343–18346. [DOI] [PMC free article] [PubMed] [Google Scholar]
- Zhai X.; Amyes T. L.; Wierenga R. K.; Loria J. P.; Richard J. P. Biochemistry 2013, 52, 5928–5940. [DOI] [PMC free article] [PubMed] [Google Scholar]
- Zhai X.; Go M. K.; Donoghue A. C.; Amyes T. L.; Pegan S. D.; Wang Y.; Loria J. P.; Mesecar A. D.; Richard J. P. Biochemistry 2014, 53, 3486–3501. [DOI] [PMC free article] [PubMed] [Google Scholar]
- Amyes T. L.; Richard J. P.; Tait J. J. J. Am. Chem. Soc. 2005, 127, 15708–15709. [DOI] [PubMed] [Google Scholar]
- Go M. K.; Amyes T. L.; Richard J. P. Biochemistry 2009, 48, 5769–5778. [DOI] [PMC free article] [PubMed] [Google Scholar]
- Amyes T. L.; Richard J. P. Biochemistry 2007, 46, 5841–5854. [DOI] [PMC free article] [PubMed] [Google Scholar]
- Richard J. P.; Zhai X.; Malabanan M. M. Bioorg. Chem. 2014, 57, 206–212. [DOI] [PMC free article] [PubMed] [Google Scholar]
- Goryanova B.; Amyes T. L.; Gerlt J. A.; Richard J. P. J. Am. Chem. Soc. 2011, 133, 6545–6548. [DOI] [PMC free article] [PubMed] [Google Scholar]
- Toth K.; Amyes T. L.; Wood B. M.; Chan K. K.; Gerlt J. A.; Richard J. P. Biochemistry 2009, 48, 8006–8013. [DOI] [PMC free article] [PubMed] [Google Scholar]
- Tsang W.-Y.; Amyes T. L.; Richard J. P. Biochemistry 2008, 47, 4575–4582. [DOI] [PMC free article] [PubMed] [Google Scholar]
- Ray W. J. Jr.; Long J. W.; Owens J. D. Biochemistry 1976, 15, 4006–4017. [DOI] [PubMed] [Google Scholar]
- Auerbach G.; Huber R.; Grättinger M.; Zaiss K.; Schurig H.; Jaenicke R.; Jacob U. Structure 1997, 5, 1475–1483. [DOI] [PubMed] [Google Scholar]
- Tadwal V. S.; Sundararaman L.; Manimekalai M. S. S.; Hunke C.; Grueber G. J. Struct. Biol. 2012, 180, 509–518. [DOI] [PubMed] [Google Scholar]
- Yamaguchi H.; Miwa Y.; Kasa M.; Kitano K.; Amano M.; Kaibuchi K.; Hakoshima T. J. Biochem. 2006, 140, 305–311. [DOI] [PubMed] [Google Scholar]
- Li G.; Liang Z. Biochem. J. 2001, 355, 681–689. [DOI] [PMC free article] [PubMed] [Google Scholar]
- Chan K.; Fedorov A. A.; Fedorov E. V.; Almo S. C.; Gerlt J. A. Biochemistry 2008, 47, 9608–9617. [DOI] [PMC free article] [PubMed] [Google Scholar]
- Denesyuk A. I.; Denessiouk K. A.; Korpela T.; Johnson M. S. Biochim. Biophys. Acta 2003, 1647, 234–238. [DOI] [PubMed] [Google Scholar]
- Amyes T. L.; Richard J. P. Biochemistry 2013, 52, 2021–2035. [DOI] [PMC free article] [PubMed] [Google Scholar]
- Malabanan M. M.; Amyes T. L.; Richard J. P. Curr. Opin. Struct. Biol. 2010, 20, 702–710. [DOI] [PMC free article] [PubMed] [Google Scholar]
- Morrow J. R.; Amyes T. L.; Richard J. P. Acc. Chem. Res. 2008, 41, 539–548. [DOI] [PMC free article] [PubMed] [Google Scholar]
- Jencks W. P. Proc. Nat. Acad. Sci. U. S. A. 1981, 78, 4046–4050. [DOI] [PMC free article] [PubMed] [Google Scholar]
- Thomas J. A.; Koshland D. E. Jr. J. Am. Chem. Soc. 1960, 82, 3329–3333. [Google Scholar]
- Koshland D. E. Jr. Proc. Natl. Acad. Sci. U. S. A. 1958, 44, 98–104. [DOI] [PMC free article] [PubMed] [Google Scholar]
- McMillan A. W.; Lopez M. S.; Zhu M.; Morse B. C.; Yeo I.-C.; Amos J.; Hull K.; Romo D.; Glasner M. E. Biochemistry 2014, 53, 4434–4444. [DOI] [PubMed] [Google Scholar]
- Nagar M.; Narmandakh A.; Khalak Y.; Bearne S. L. Biochemistry 2011, 50, 8846–8852. [DOI] [PubMed] [Google Scholar]
- Torres R.; Lan B.; Latif Y.; Chim N.; Goulding C. W. Acta Crystallogr., Sect. D: Biol. Crystallogr. 2014, 70, 1074–1085. [DOI] [PMC free article] [PubMed] [Google Scholar]
- Axe J. M.; Boehr D. D. J. Mol. Biol. 2013, 425, 1527–1545. [DOI] [PubMed] [Google Scholar]
- Porter C. M.; Miller B. G. Bioorg. Chem. 2012, 43, 44–50. [DOI] [PMC free article] [PubMed] [Google Scholar]
- Johnson T. A.; Holyoak T. Biochemistry 2012, 51, 9547–9559. [DOI] [PMC free article] [PubMed] [Google Scholar]
- Carpenter R. A.; Xiong J.; Robbins J. M.; Ellis H. R. Biochemistry 2011, 50, 6469–6477. [DOI] [PubMed] [Google Scholar]
- Wood B. M.; Chan K. K.; Amyes T. L.; Richard J. P.; Gerlt J. A. Biochemistry 2009, 48, 5510–5517. [DOI] [PMC free article] [PubMed] [Google Scholar]
- Bergemeyer H. U.; Haid E.; Nelboeck-Hochstetter M. US Patent US3662037 A,1972.
- Amyes T. L.; Wood B. M.; Chan K.; Gerlt J. A.; Richard J. P. J. Am. Chem. Soc. 2008, 130, 1574–1575. [DOI] [PMC free article] [PubMed] [Google Scholar]
- Barnett S. A.; Amyes T. L.; Wood B. M.; Gerlt J. A.; Richard J. P. Biochemistry 2008, 47, 7785–7787. [DOI] [PMC free article] [PubMed] [Google Scholar]
- Protein Identification and Analysis Tools on the ExPASy Server; Gasteiger E., Hoogland C., Gattiker A., Duvaud S., Wilkins M. R., Appel R. D., Bairoch A., Eds.; Humana Press, Inc.: Totowa, NJ, 2005. [DOI] [PubMed] [Google Scholar]
- Gasteiger E.; Gattiker A.; Hoogland C.; Ivanyi I.; Appel R. D.; Bairoch A. Nucleic Acids Res. 2003, 31, 3784–3788. [DOI] [PMC free article] [PubMed] [Google Scholar]
- Amyes T. L.; Richard J. P. J. Am. Chem. Soc. 1996, 118, 3129–3141. [Google Scholar]
- Amyes T. L.; Richard J. P. J. Am. Chem. Soc. 1992, 114, 10297–10302. [Google Scholar]
- O’Donoghue A. C.; Amyes T. L.; Richard J. P. Biochemistry 2005, 44, 2610–2621. [DOI] [PubMed] [Google Scholar]
- Amyes T. L.; Ming S. A.; Goldman L. M.; Wood B. M.; Desai B. J.; Gerlt J. A.; Richard J. P. Biochemistry 2012, 51, 4630–4632. [DOI] [PMC free article] [PubMed] [Google Scholar]
- Malabanan M. M.; Koudelka A. P.; Amyes T. L.; Richard J. P. J. Am. Chem. Soc. 2012, 134, 10286–10298. [DOI] [PMC free article] [PubMed] [Google Scholar]
- Malabanan M. M.; Go M. K.; Amyes T. L.; Richard J. P. Biochemistry 2011, 50, 5767–5779. [DOI] [PMC free article] [PubMed] [Google Scholar]
- Black W. J. Can. J. Biochem. Phys. 1966, 44, 1301–1317. [DOI] [PubMed] [Google Scholar]
- Reynolds S. J.; Yates D. W.; Pogson C. I. Biochem. J. 1971, 122, 285–297. [DOI] [PMC free article] [PubMed] [Google Scholar]
- Maier K.; Hinze H.; Leuschel L. Biochim. Biophys. Acta 1986, 848, 120–130. [Google Scholar]
- Young P. R.; Jencks W. P. J. Am. Chem. Soc. 1978, 100, 1228–1235. [Google Scholar]
- Young P. R.; Jencks W. P. J. Am. Chem. Soc. 1977, 99, 1206–1214. [Google Scholar]
- Go M. K.; Koudelka A.; Amyes T. L.; Richard J. P. Biochemistry 2010, 49, 5377–5389. [DOI] [PMC free article] [PubMed] [Google Scholar]
- Jencks W. P.Catalysis in Chemistry and Enzymology; McGraw Hill: New York, 1969. [Google Scholar]
- Jencks W. P. Adv. Enzymol. Relat. Areas Mol. Biol. 1975, 43, 219–410. [DOI] [PubMed] [Google Scholar]
- Ou X.; Ji C.; Han X.; Zhao X.; Li X.; Mao Y.; Wong L.-L.; Bartlam M.; Rao Z. J. Mol. Biol. 2006, 357, 858–869. [DOI] [PubMed] [Google Scholar]
- Lolis E.; Petsko G. A. Biochemistry 1990, 29, 6619–6625. [DOI] [PubMed] [Google Scholar]
- Miller B. G.; Hassell A. M.; Wolfenden R.; Milburn M. V.; Short S. A. Proc. Nat. Acad. Sci. U. S. A. 2000, 97, 2011–2016. [DOI] [PMC free article] [PubMed] [Google Scholar]
- Barnett S. A.; Amyes T. L.; McKay Wood B.; Gerlt J. A.; Richard J. P. Biochemistry 2010, 49, 824–826. [DOI] [PMC free article] [PubMed] [Google Scholar]
- Goryanova B.; Goldman L. M.; Amyes T. L.; Gerlt J. A.; Richard J. P. Biochemistry 2013, 52, 7500–7511. [DOI] [PMC free article] [PubMed] [Google Scholar]
- Go M. K.; Amyes T. L.; Richard J. P. J. Am. Chem. Soc. 2010, 132, 13525–13532. [DOI] [PMC free article] [PubMed] [Google Scholar]
- Frey P. A.; Sammons R. D. Science 1985, 228, 541–545. [DOI] [PubMed] [Google Scholar]
- Goryanova B.; Spong K.; Amyes T. L.; Richard J. P. Biochemistry 2013, 52, 537–546. [DOI] [PMC free article] [PubMed] [Google Scholar]
- Malabanan M. M.; Amyes T. L.; Richard J. P. J. Am. Chem. Soc. 2011, 133, 16428–16431. [DOI] [PMC free article] [PubMed] [Google Scholar]
- Kholodar S. A.; Murkin A. S. Biochemistry 2013, 52, 2302–2308. [DOI] [PubMed] [Google Scholar]
- Herschlag D. Bioorg. Chem. 1988, 16, 62–96. [Google Scholar]
- Wolfenden R. Mol. Cell. Biochem. 1974, 3, 207–211. [DOI] [PubMed] [Google Scholar]
- Warshel A. J. Biol. Chem. 1998, 273, 27035–27038. [DOI] [PubMed] [Google Scholar]
- Wierenga R. K.; Noble M. E. M.; Vriend G.; Nauche S.; Hol W. G. J. J. Mol. Biol. 1991, 220, 995–1015. [DOI] [PubMed] [Google Scholar]
- Alahuhta M.; Wierenga R. K. Proteins: Struct., Funct., Bioinf. 2010, 78, 1878–1888. [DOI] [PubMed] [Google Scholar]
- Kursula I.; Wierenga R. K. J. Biol. Chem. 2003, 278, 9544–9551. [DOI] [PubMed] [Google Scholar]
- Malabanan M. M.; Nitsch-Velasquez L.; Amyes T. L.; Richard J. P. J. Am. Chem. Soc. 2013, 135, 5978–5981. [DOI] [PMC free article] [PubMed] [Google Scholar]
- Richard J. P. Biochemistry 1998, 37, 4305–4309. [DOI] [PubMed] [Google Scholar]
- He H.; Chen Q.; Georgiadis M. M. Biochemistry 2014, 53, 6520–6529. [DOI] [PMC free article] [PubMed] [Google Scholar]
- Chaganti L. K.; Kuppili R. R.; Bose K. FASEB J. 2013, 27, 3054–3066. [DOI] [PubMed] [Google Scholar]
- Selvaraj M.; Roy S.; Singh N. S.; Sangeetha R.; Varshney U.; Vijayan M. J. Mol. Biol. 2007, 372, 186–193. [DOI] [PubMed] [Google Scholar]
- Ingvarsson H.; Mate M. J.; Hoegbom M.; Portnoi D.; Benaroudj N.; Alzari P. M.; Ortiz-Lombardia M.; Unge T. Acta Crystallogr., Sect. D: Biol. Crystallogr. 2007, 63, 249–259. [DOI] [PubMed] [Google Scholar]
- Richard J. P. Biochemistry 2013, 52, 2009–2011. [DOI] [PMC free article] [PubMed] [Google Scholar]
- Francis K.; Kohen A. Curr. Opin. Chem. Biol. 2014, 21, 19–24. [DOI] [PMC free article] [PubMed] [Google Scholar]
- Nashine V. C.; Hammes-Schiffer S.; Benkovic S. J. Curr. Opin. Chem. Biol. 2010, 14, 644–651. [DOI] [PMC free article] [PubMed] [Google Scholar]
- Roca M.; Oliva M.; Castillo R.; Moliner V.; Tunon I. Chem.—Eur. J. 2010, 16, 11399–11411. [DOI] [PubMed] [Google Scholar]
- Saen-Oon S.; Ghanem M.; Schramm V. L.; Schwartz S. D. Biophys. J. 2008, 94, 4078–4088. [DOI] [PMC free article] [PubMed] [Google Scholar]
- Cannon W. R.; Benkovic S. J. J. Biol. Chem. 1998, 273, 26257–26260. [DOI] [PubMed] [Google Scholar]
- Warshel A.; Florian J.; Strajbl M.; Villa J. ChemBioChem 2001, 2, 109–111. [DOI] [PubMed] [Google Scholar]
- Adamczyk A. J.; Cao J.; Kamerlin S. C. L.; Warshel A. Proc. Natl. Acad. Sci. U. S. A. 2011, 108, 14115–14120. [DOI] [PMC free article] [PubMed] [Google Scholar]


