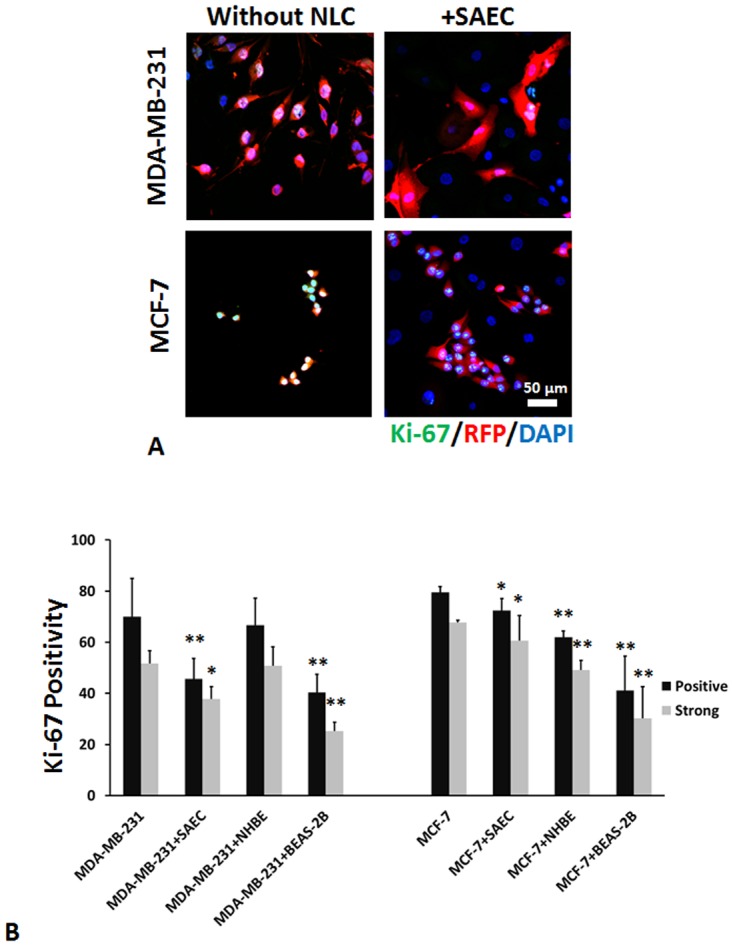
Fig 2. Proliferative fraction of breast cancer cells in co-culture.

(A) Representative immunofluorescence images of Ki67 staining of MDA-MB-231 and MCF-7 cells in monoculture versus co-culture with SAEC on day 6 after seeding. Scale bar 50 μm, shown are representative of three experiments using confocal imaging. (B) Percent Ki-67 positivity of just the MDA-MB-231 or MCF-7 with or without co-culture. Shown are mean ± s.e.m. *p value < 0.05, compared to the controls using Chi-squared comparisons to distinguish differences in frequencies in independent populations.
