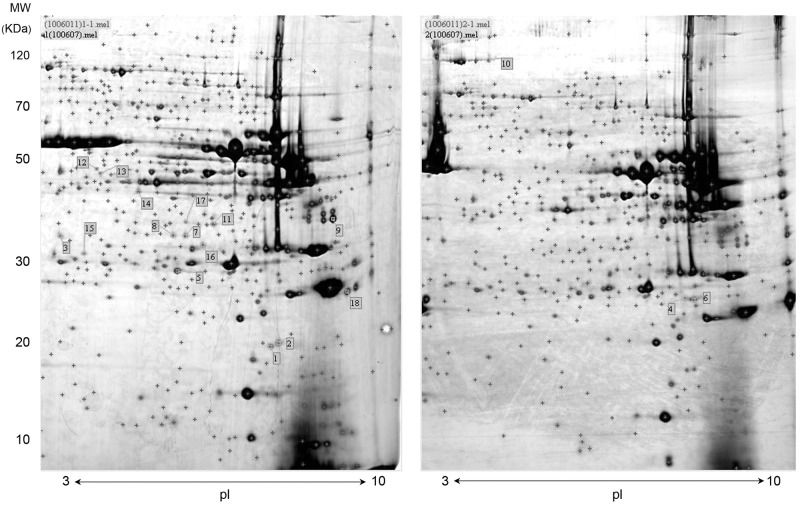
Fig 1. Representative 2-DE images of longissimus muscle samples.
2-DE was per-formed using a pH range of 3–10 in the first dimension and SDS-PAGE (12%) in the second. Control sample is shown at the left and sample from 1% arginine supplementation is shown at the right. Detected protein spots are marked with red “+” and protein abundances that differ significantly between control and supplemented pigs are assigned numbers, corresponding to Table 7. MW, Molecular weight; PI, Isoelectric point.

