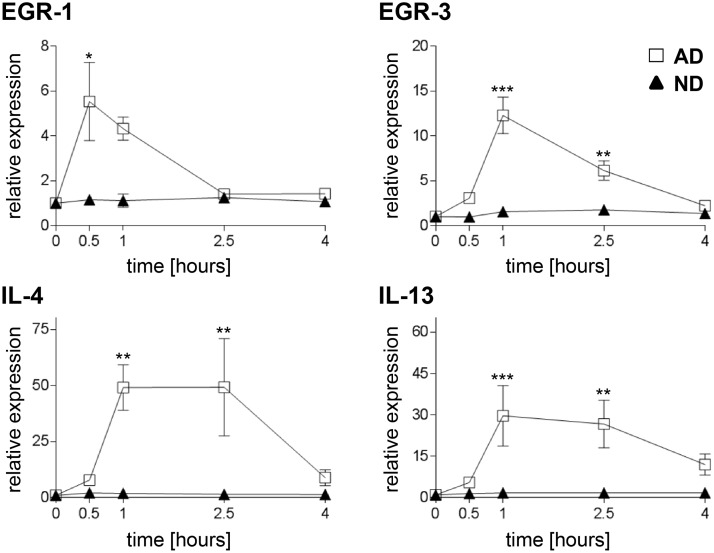
Fig 5. Gene expression of MoDCs induced by Bet v 1.
Cells of BP allergic (squares) and normal donors (triangles) were either sham-treated or treated with Bet v 1 for the indicated times. mRNA levels of EGR-1 and-3 and the Th2 cytokines IL-4 and IL-13 were analyzed by real-time PCR. Expression levels, normalized to the average of housekeeping genes, are shown relative to non-stimulated cells. Data are presented as mean values ± SEM (n = 7 in both groups) performed in duplicates. Significance is indicated by asterisks (* p < 0.05; ** p < 0.01; *** p < 0.001).

