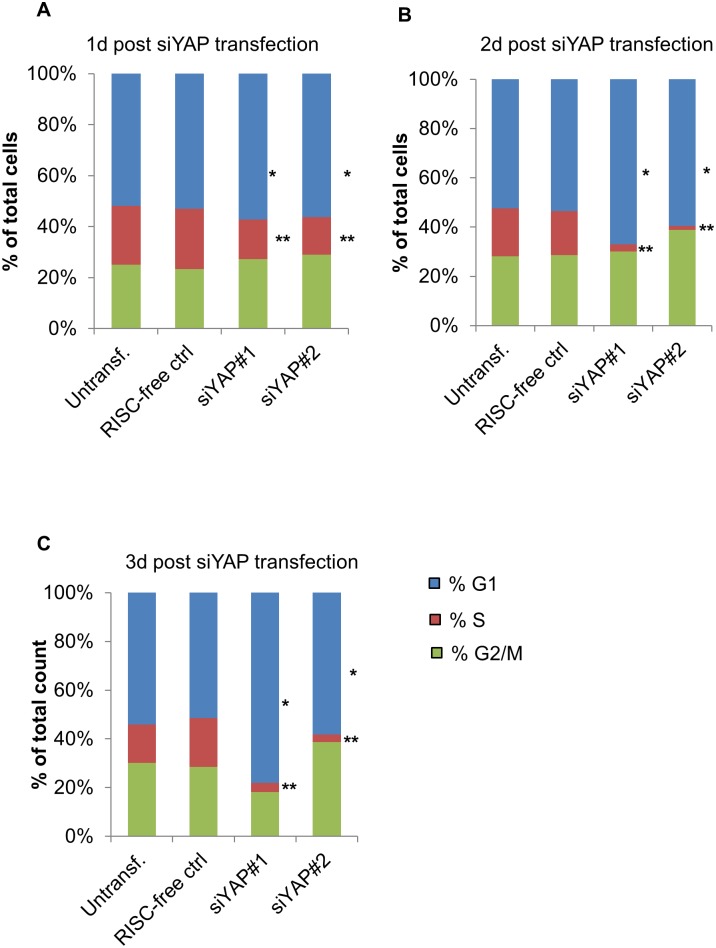
Fig 2. Yap knockdown in HUVECs results in G1 accumulation.
A. Quantitative comparisons of cell cycle profiles comparing control and YAP-KD cells 1 d after siRNA transfection. Cells were incubated with BrdU for 1 hour and then stained for BrdU followed by FACS analysis. Data are plotted as the percentage of cells in each stage of the cell cycle (see S3 Fig.). HUVECs treated with siYAP exhibited a significant decrease in S-phase and increase in G1-phase at this time point. p-values were calculated by comparing each phase to the corresponding datasets from RISC-free control. *, p < 0.04; **, p < 0.007. B. Quantitative comparisons of cell cycle profiles between control and YAP-KD cells 2 d after siRNA transfection. Cells were processed and the data examined statistically as described in (A). *, p < 0.04; **, p < 0.007. C. Quantitative comparisons of cell cycle profiles between control and YAP-KD cells 3 d after siRNA transfection. Cells were processed and the data examined statistically as described in (A). *, p < 0.04; **, p < 0.007. See also S3 and S4 Figs.

