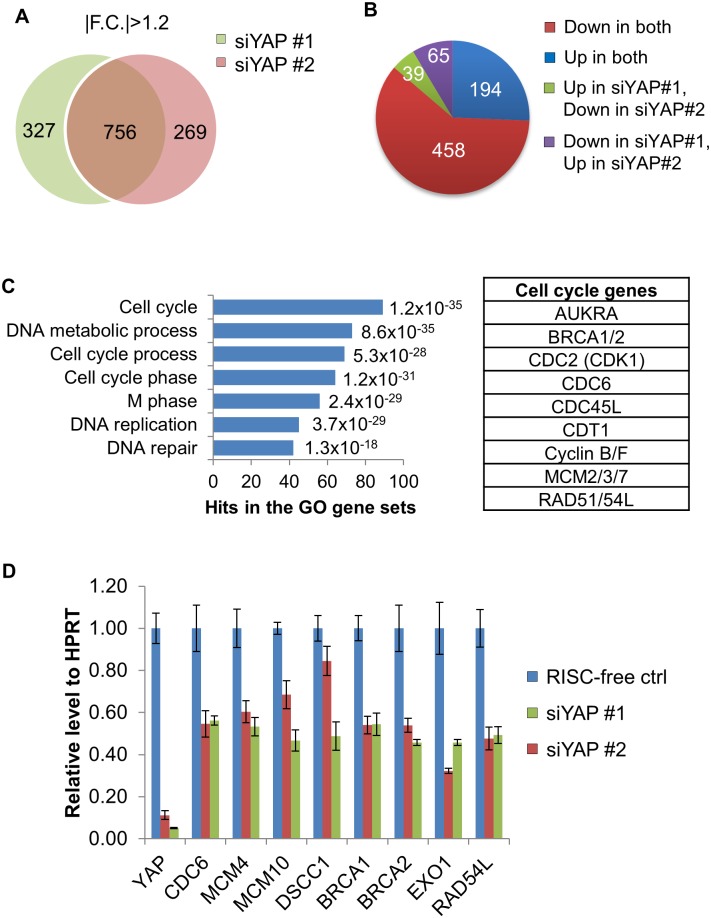
Fig 5. YAP regulates the expressions of factors critical for replication origin biology and homologous recombination.
A. Venn diagram comparing microarray analysis results from HUVECs treated with either siYAP#1 or siYAP#2 for 30 h. Candidate genes with expression fold change of 1.2 or more, a p-value less than 0.05, and a false discovery rate (FDR) of less than 0.1 were used. 756 genes were common hits for the siRNA transfected cells, a number that corresponds to approximately 70% of the genes that exhibited expression changes with either siRNA. Fold changes were calculated using RISC-free control line as the reference group. Each condition contains four biological replicates (N = 4). B. Pie chart analysis of the 756 genes from (A). “Up” and “down” represent the directionality of expression changes of each gene in siYAP #1 or #2 treated HUVEC. Most of the 756 genes were down-regulated with both siRNAs (red group). Approximately 25% of genes were up-regulated with both siRNAs (blue group), while 14% showing discordant directionality of change (green and purple groups). C. DAVID bioinformatics gene ontology analysis of the top 8 hits/pathways within the red group from (B). The number of hits in each matching gene ontology group is graphed on the X-axis, with weighed p-values listed next to each histogram. Representative candidate genes with major roles in cell cycle regulation identified in the ontology analysis were listed in the “Cell cycle genes” table. D. RT-PCR validation of the microarray results. All candidates except DSCC1 exhibited significant expression changes in siYAP#1- and siYAP#2-treated cells. Transcript abundance was calculated by normalizing each measurement to an HPRT control. See also S7 and S8 Figs.

