
Fig 5. Fluorescence excitation spectra of human plasminogen (330 nm emission).
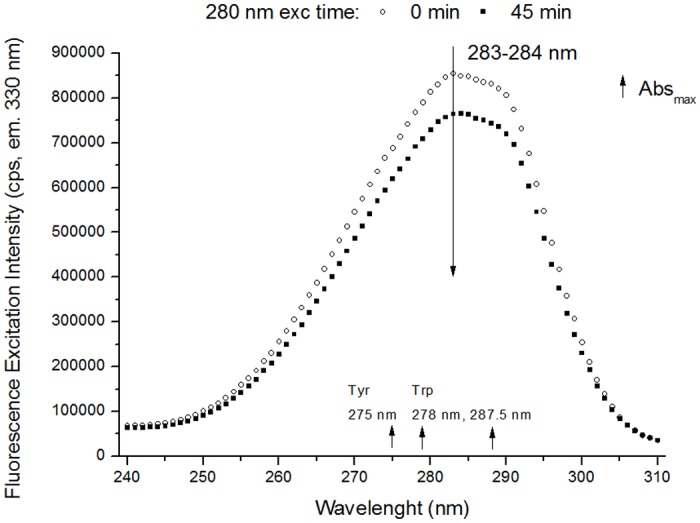
The excitation spectra (em. 330 nm) were obtained before and after 280 nm light continuous illumination (45 min) of human plasminogen in solution. After 45 min of 280 nm illumination there is a decrease in excitation intensity at ~283 nm. Small increasing arrows indicate the wavelengths of maximum absorption (Absmax) of Trp and Tyr in solution.