
Fig 12. Circular dichroism thermal unfolding curves of human plasminogen.
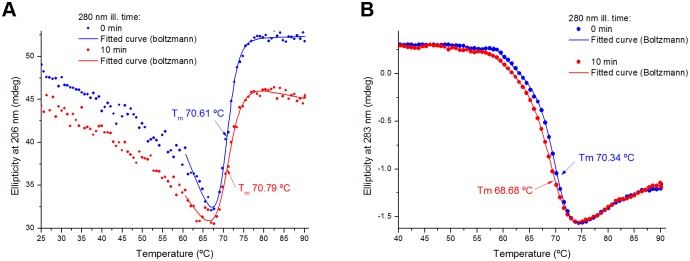
The circular dichroims thermal unfolding curves of a non-illuminated plasminogen sample (0 min 280 nm ill. time) or a UV illuminated plasminogen sample (10 min 280 nm ill. time) were obtained upon heating from 25 ºC to 90 ºC (1 ºC.min-1). A- The ellipticity signal was constantly monitored at 206 nm. B- The ellipticity signal was constantly monitored at 283 nm. Both curves were fitted using a modified Boltzmann function (see Table 7). The melting temperature of the protein, which corresponds to the transition mid-point of each curve, was recovered from the fitting (parameter x0) and is displayed for each sample.