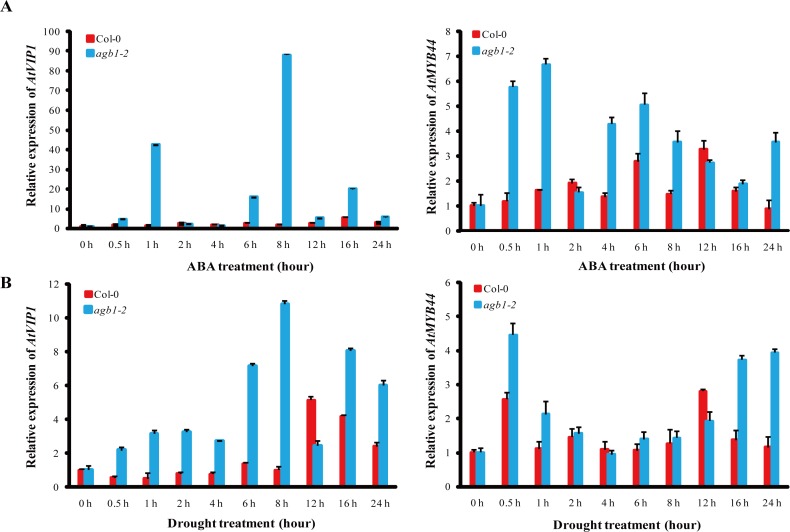
Figure 4. Expression of AtVIP1 and AtMYB44 in WT and agb1-2 after ABA and drought treatments.
(A) and (B) Expression analysis of AtVIP1 and AtMYB44 in WT and agb1-2 plants after ABA (A) and drought (B) treatments for 0, 0.5, 1, 2, 4, 6, 8, 12, 16, and 24 h. Results are means ± SD with three biological replicates.

