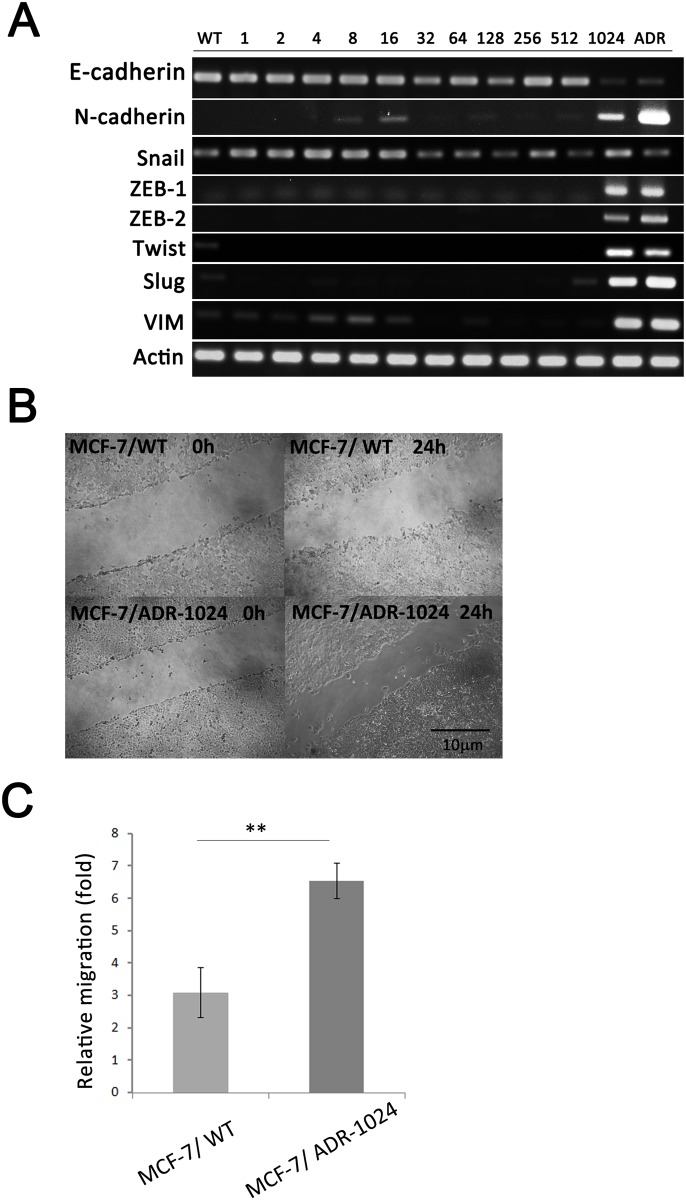
Figure 6. EMT processes in the induction of doxorubicin resistance.
(A) EMT-related gene expression profile in the series of MCF-7/ADR-n cell lines. mRNA levels of E-cadherin, N-cadherin, vimentin, ZEB1, ZEB2, Slug, Snail and Twist were detected using RT-PCR. (B) Cell migration of MCF-7/WT and MCF-7/ADR-1024 cells was assessed by wound healing assay. Photographs were obtained at 0 and 24 h to monitor cell migration for the closure of the wound; Scale bar = 10 μM. (C) Graph shows relative cell migration distance of MCF-7/ADR-1024 cells. Data are expressed as the mean±S.E.M of three separate experiments (n = 3). **p<0.01.

