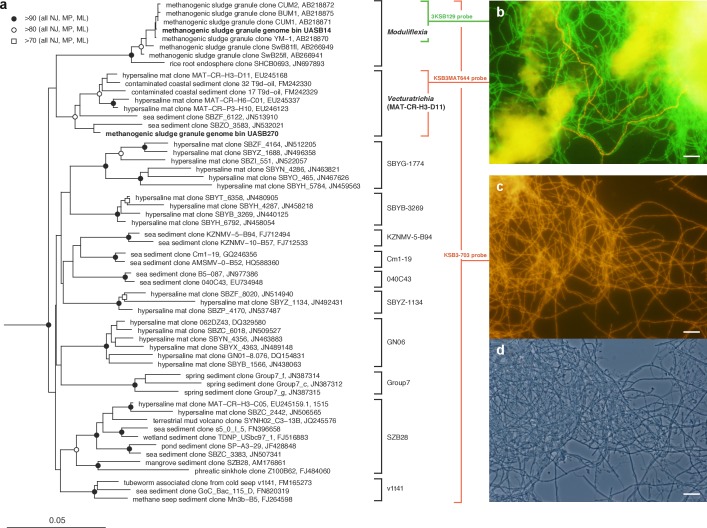
Figure 1. Phylogenetic structure of the Modulibacteria (KSB3) phylum based on comparative analysis of 16S rRNA gene sequences, and imaging of KSB3 cells.
(A) Maximum-likelihood phylogenetic tree (RAxML) of public data (accession numbers shown) and the 16S rRNA sequence determined in this study for UASB14. Sequences from the bacterial phyla Nitrospirae, Tenericutes, and Chloroflexi were used to root the tree (not shown). Reproducible interior nodes are indicated as a black circle (>90% bootstrap support for neighbor-joining [NJ], maximum parsimony [MP], and maximum-likelihood [ML] inferences), open circle (>80% support); or open rectangle (>70% support). Nodes without symbols were not reproducible between trees. The scale bar represents 5% estimated sequence divergence. Class-level clades are bracketed to the right of the figure in black. The target ranges of KSB3-specific FISH (fluorescence in situ hybridization) probes used in this study are indicated by colored brackets with the colors corresponding to cell color in (B) and (D). (B) 16S rRNA-targeted FISH detection of UASB14 and UASB270 filaments in the UASB sludge. The abundant UASB14 filaments are labeled green and the low abundance UASB270 filaments are labeled red. (C) Total KSB3 filament abundance highlighted by a phylum-level FISH probe relative to (D) all cells present in the same field (phase-contrast image). Bars in (B–D) represent 10 µm.

