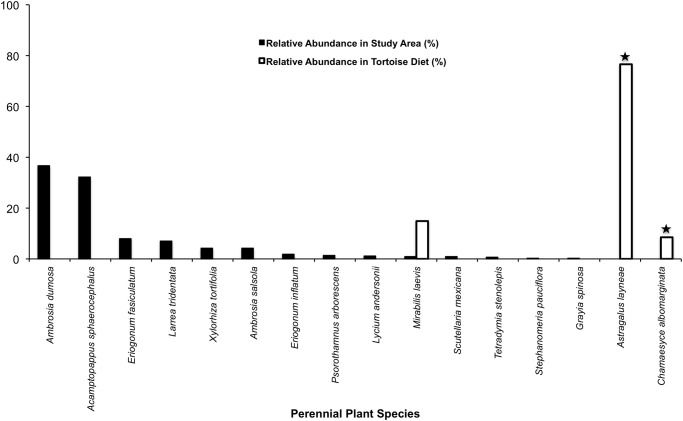
Fig 6. Tortoise diet in relation to perennial plant abundance during mid-spring.
Solid black bars show the relative abundance of each species found in the study area, whereas white bars indicate the relative abundance of each species in tortoise diet during the same period. Star symbols above bars denote plants in tortoise diet that were not detected in the plant survey.

