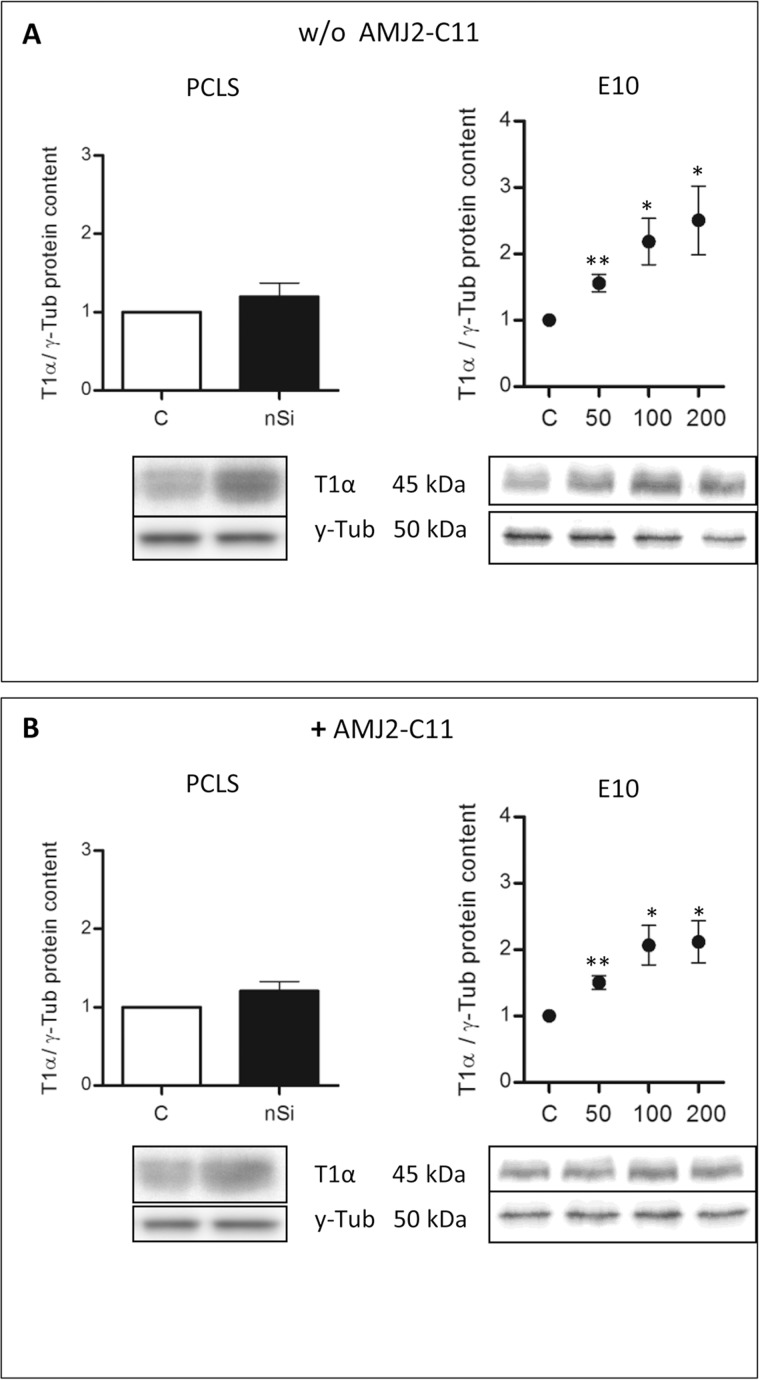
Figure 2. Protein content of T1α in the PCLS of wild type mice and the alveolar epithelial cell line E10.
Immunoblots of PCLS and E10 experiments without (A) and with AMJ2-C11 macrophages (B). For PCLS the concentration of nano-silica was 1600 µg/ml and for E10 experiments nano-silica concentrations ranging from 50 to 200 µg/cm2 flask area were used. Data of each silica group was normalized to the control. Incubation time of PCLS was 72 hours and for E10 experiments 48 hours. γ-Tub is the loading control, n = 6–7.

