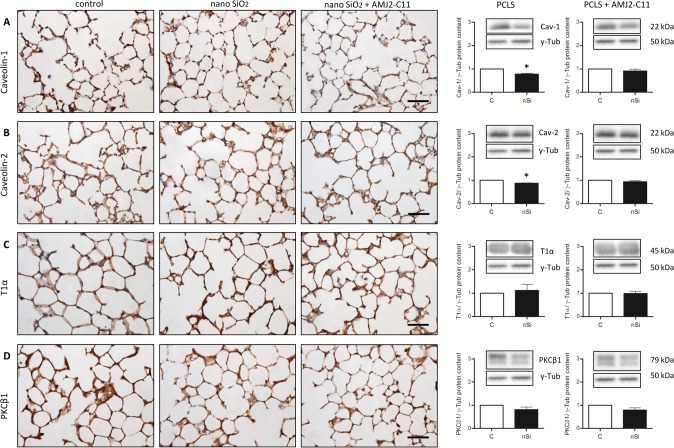
Figure 8. Immunohistochemical staining and protein content of Cav-1 (A), Cav-2 (B), T1α (C) and PKC-β1 (D) of untreated lung slices, slices treated with 1600 µg/ml silica and slices treated with 1600 µg/ml silica and co-cultured with AMJ2-C11 macrophages after 72 hours incubation.
γ-Tub is the loading control, n = 6–7. Scale bar = 50 µm.

