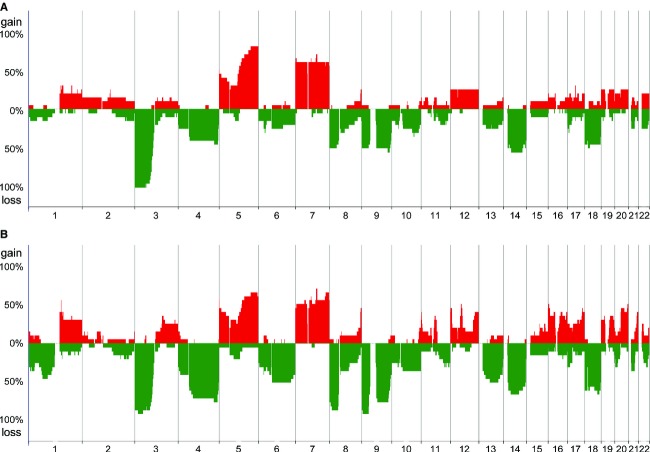
Figure 1.
Genomic profiles of primary ccRCCs and corresponding metastases. Genome-wide averaged frequencies of genomic imbalances in 20 cases (patient group I) of primary ccRCC (A) and their corresponding metastases (B). Oligonucleotide probes are shown in order within each chromosome from chromosomes 1 to 22. The frequencies (%) of gains (positive axis) and losses (negative axis) are shown for each probe in primary ccRCCs and their corresponding metastases.

