
Figure 4.
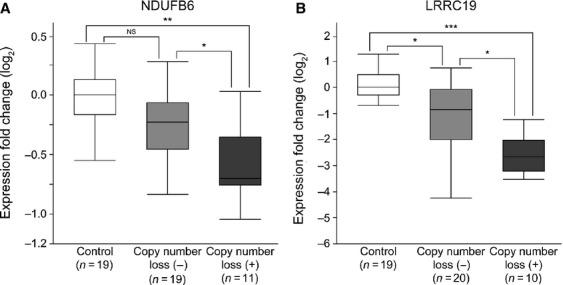
Downregulation of NDUFB6 and LRRC19 due to gene copy number loss. Expression levels of NDUFB6 (A) and LRRC19 (B) were significantly lower in primary ccRCCs with copy number loss than in those without it, and they were also significantly lower than in normal control tissues. Quantitative RT-PCR analyses of 30 primary ccRCCs and 19 samples of normal control tissue (patient group II) were performed. The y-axis displays the expression level (log2) normalized by the median expression level for the 19 normal control samples. *P < 0.05, **P < 0.001, and ***P < 0.0001 determined by Kruskal–Wallis test and Steel–Dwass test as a post hoc test. NS, not significant.