Figure 1.
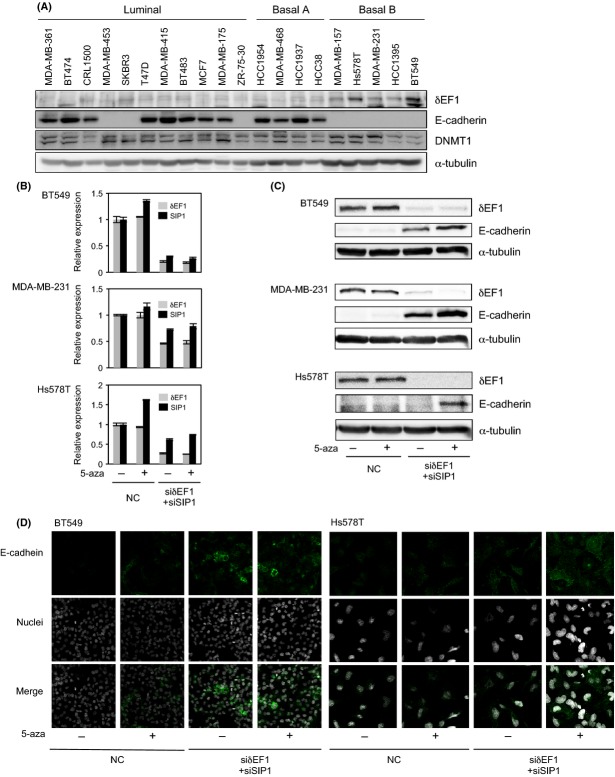
Expression profiles of E-cadherin, δEF1, and DNMT1 in human breast cancer cells. (A) Protein levels of E-cadherin, δEF1, and DNMT1 were determined by immunoblot analysis of whole-cell extracts. α-tubulin levels were monitored as a loading control. Molecular subtypes are as reported by Neve et al. 2. and Charafe-Jauffret et al. 3. (B, C, and D) BT549, MDA-MB-231, and Hs578T cells were transfected with siRNAs against both δEF1 and SIP1, and then treated with 5 μmol/L of 5-aza-2′-deoxycytidine (5-aza) for 48 h (for BT549 and MDA-MB-231 cells) or 1 μmol/L of 5-aza for 72 h (for Hs587T cells). Cells were then harvested and examined for expression of δEF1, SIP1, and E-cadherin by quantitative RT-PCR (B), immunoblotting (C), or immunocytochemistry (D). NC, negative control.

