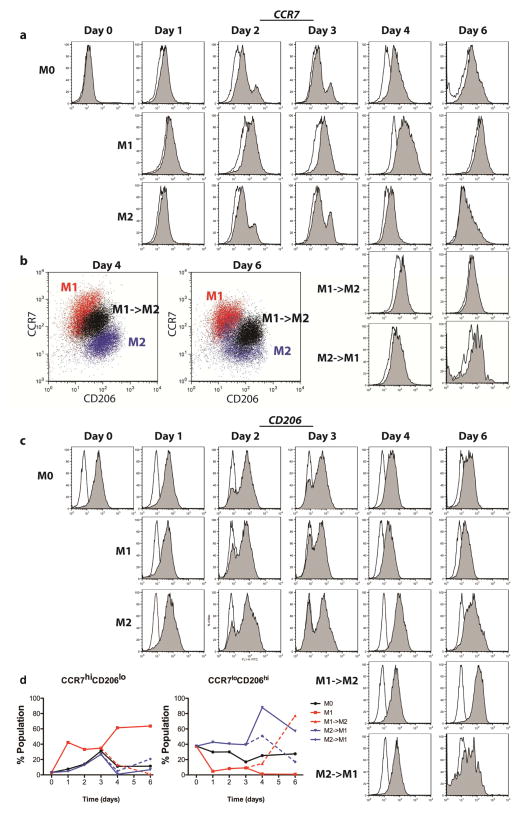
Figure 2. Expression of surface markers of macrophage phenotype, determined by flow cytometry.
(a) Histograms showing intensity of CCR7 expression, an M1 marker, over time for each group. Open histograms represent the isotype control. b) Scatterplots representing intensity of CCR7 and CD206 staining for dual-stained samples (arbitrary units). The switched phenotype group (M1->M2) shows intermediate staining between M1 and M2 controls at days 4 and 6. (c) Histograms showing intensity of CD206 expression, and M2 marker, over time for each group. Open histograms represent the isotype control. (d) The proportions of each populations staining both at a high level for CCR7 and a low level for CD206 (CCR7hiCD206lo), indicative of a strong M1 phenotype, or those staining both at a low level for CCR7 and a high level for CD206 (CCR7loCD206hi), indicative of a strong M2 phenotype.

