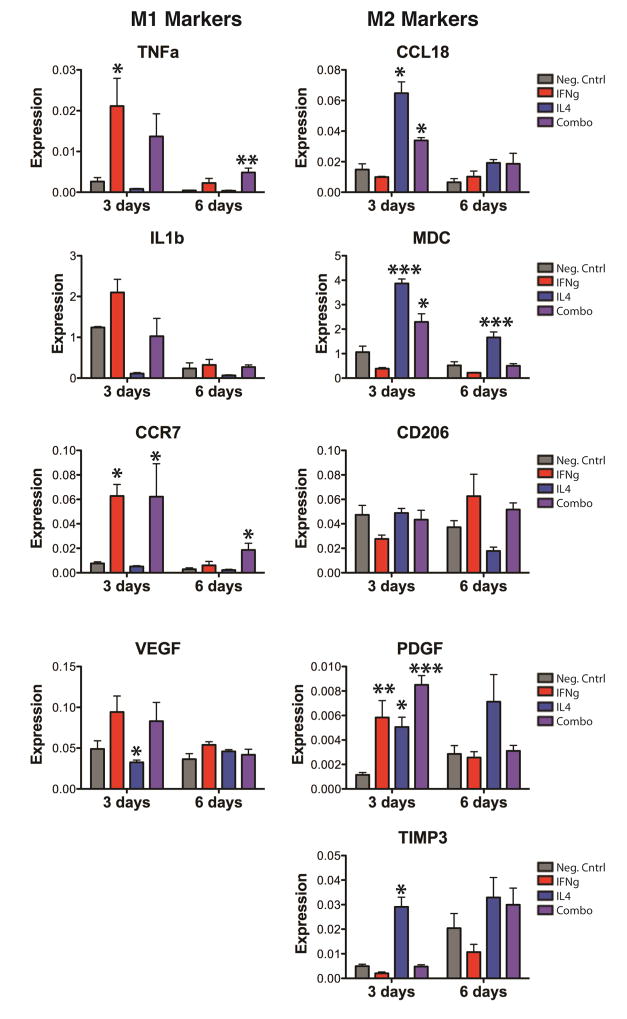
Figure 6. Gene expression changes of macrophages on immunomodulatory scaffolds over time.
Data are represented as fold change over GAPDH (2−ΔCt). *p<0.05, **p<0.01, and ***p<0.001 compared to the negative control, analyzed using one-way ANOVA at each timepoint with Dunnett’s post-hoc analysis (mean+/− SEM, n=4). Representative data from experiments that were repeated three times.

