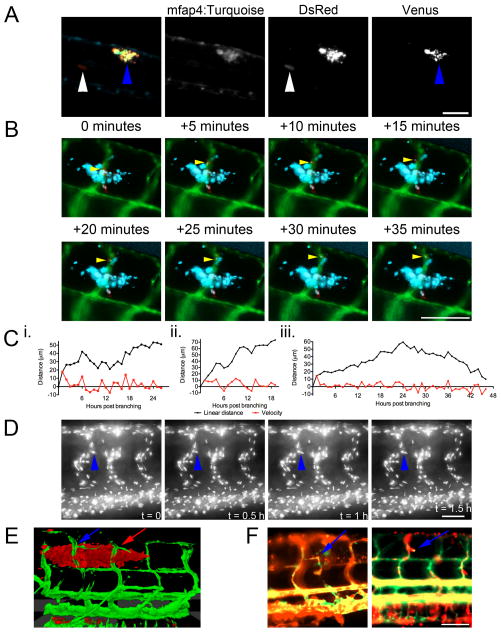
Extended Data 1.
(A) Image of 6 dpi Tg(mfap4:turquoisext27) larvae infected with M. marinum SM2 pMAP49::Venus. Blue arrowheads indicates site of granuloma with induced expression of Venus from phagocytosed M. marinum. White arrowheads indicate sites of extracellular M. marinum growth detected by constitutive DsRed expression but no macrophage-induced Venus expression. Image is representative of granulomas found in 5 individual animals.
(B) Time-lapse images of M. marinum-cerulean dissemination from an established granuloma into the adjacent intersegmental vessel in a Tg(flk1:EGFP, mpeg1:tomato-caaxtd3) double transgenic larva where bacterial are blue labelled, blood vessels are green labelled and macrophages are red labelled. Yellow arrow tracks a single infected macrophage egressing the established granuloma and entering the vasculature. Images are representative of macrophage behaviour in 3 individual animals.
(C) Plots of vessel growth kinetics from three individual branches in individual Tg(flk1:EGFP) larvae. Video of each larva analysed is available in Supplementary Videos 6 and 7 (i.), and 8 and 9 (iii.).
(D) Time-lapse images of nuclear division during vascular growth in a single Tg(fli1a:EGFP-nls) larva. Blue arrowhead indicates nucleus of interest. Images are representative of nuclear division in 10 individual animals. Video of nuclear division is available in Supplementary Video 10.
(E) Three-dimensional rendering of recruited blood vessels in a Tg(flk1:EGFP) larva infected with M. marinum-tomato originating from arterial and venous ISVs as indicated by red and blue arrows, respectively. Image is representative of 10 individual animals.
(F) Extended exposure images of blood flow in Tg(flk1:EGFP, gata1:DsRedsd2) larvae. Blue arrows indicate blood flow through ectopic vessels. Images are representative of blood flow in 20 individual animals. Scale bars indicate 100 μm.

