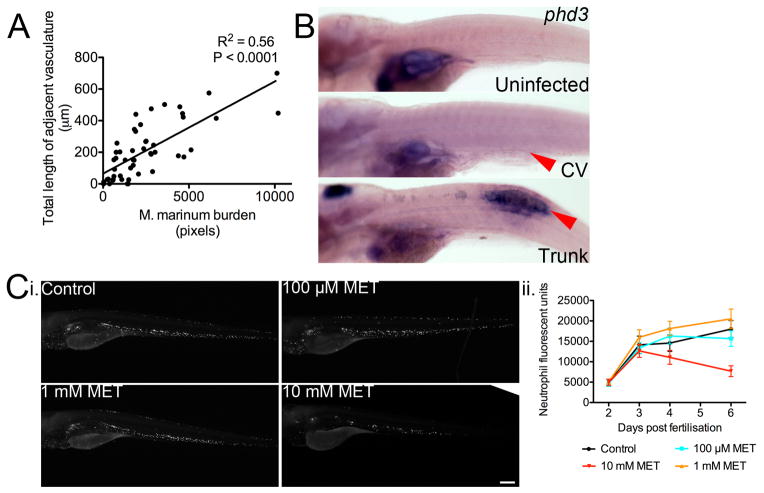
Extended Data 3.
(A) Plot of abnormal vasculature length and bacterial burden for individual foci of infection measured by FPC in Tg(flk1:EGFP) larvae. Slope significantly not zero, P < 0.0001 linear regression, data are pooled from three biological replicates.
(B) Whole mount in situ hybridisation detection of phd3 expression. Images are representative of phd3 staining in Uninfected (20/20), CV (20/20) and Trunk (7/20).
(C) i. Images of Tg(lyzC:ntr-p2A-lanYFPxt14) larvae treated with metronidazole as indicated. Green arrowheads indicate comparative locations within caudal haematopoietic tissue. Images are median images from experimental groups Control n=21, 100 μM n=22, 1 mM n=24 and 10 mM n=19. ii. Quantification of neutrophil numbers by area of fluorescence in Tg(lyzC:ntr-p2A-lanYFPxt14) larvae treated with metronidazole from 2 dpf to 6 dpf. Error bars represent mean ± standard deviation.

