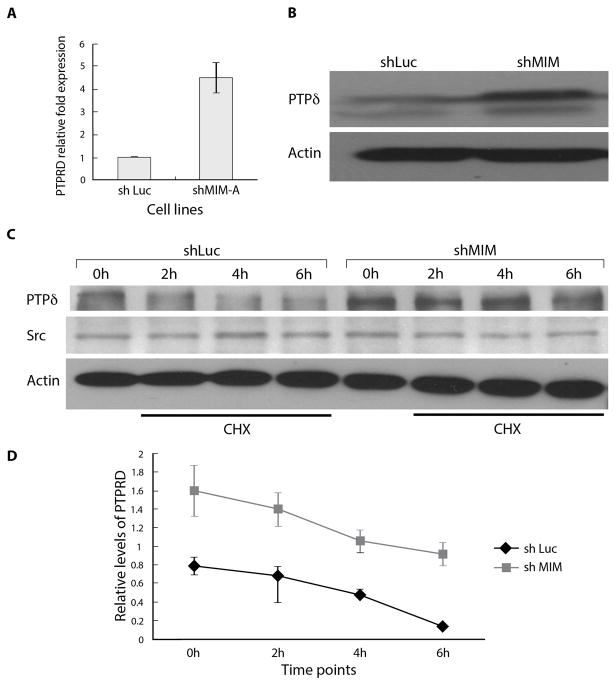
Figure 3. Suppression of MIM increased the mRNA and protein levels of PTPδ.
(A) Quantitative real time PCR analysis of RNA extracted from cells expressing indicated shRNA to illustrate that MCF10A cells with MIM-directed shRNA is accompanied by increased levels of PTPRD mRNA. (B) Immunoblot of lysates expressing indicated shRNA to illustrate that treatment of MCF10A cells with MIM-directed shRNA is accompanied by increased levels of PTPδ. (C) Control and shMIM-expressing MCF10A cells were treated with cyclohexamide, and lysates were prepared at the indicated time points. The levels of PTPδ was assessed by immunoblotting (20 μg of total lysate protein). The levels of SRC were measured as a control. (D) Quantitation of PTPδ stability from three independent experiments is indicated. Error bars represent S.E.M.

