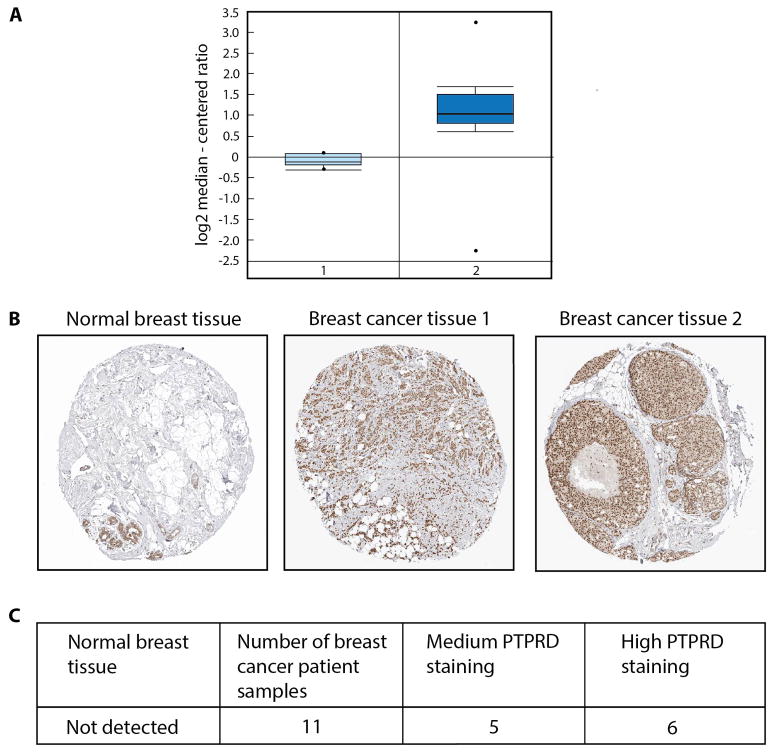
Figure 4. Expression of PTPδ in human tumor samples.
(A) PTPδ expression was analyzed in datasets from the Oncomine (Compendia Bioscience) database (http://www.oncomine.org). The Finak Breast dataset, which constituted 53 breast tumor stroma samples and 6 normal breast stroma samples that were analyzed on Agilent 44K microarrays, showed increased mRNA levels of PTPδ in the tumor samples (P value is 7.94E-15). (B) PTPδ protein expression data from the Human Protein Atlas (www.proteinatlas.org). Representative images of Immunohistochemistry staining for one sample of normal breast tissue and two breast cancer tissue specimens from patients are shown. (C) Table indicates PTPδ protein expression levels analyzed by immunohistochemistry in 11 patient samples, of which 5 patient samples showed medium and 6 patient samples showed high staining relative to the normal breast tissue.

