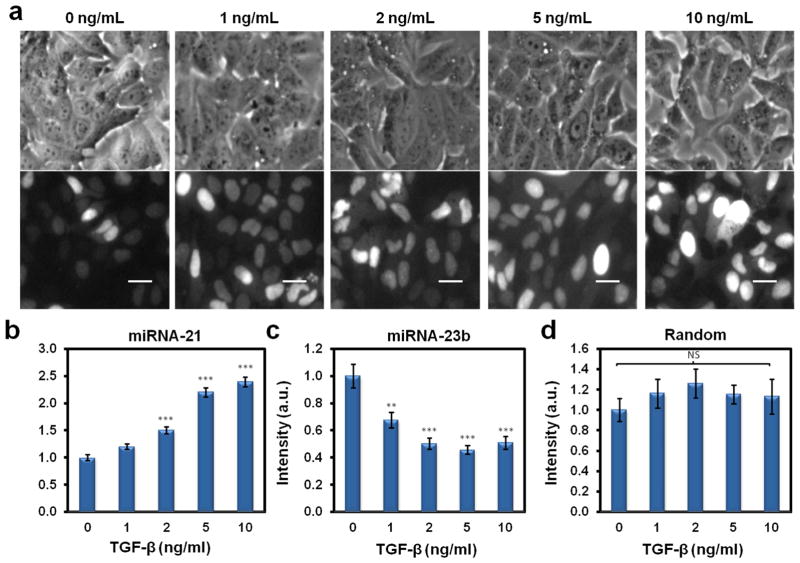
Fig. 2.
TGF-β-induced, dose-dependent increase in miR-21. (a) Bright-field images (top row) and their corresponding fluorescence images (bottom row) illustrating the increase in miR-21 signal seen in the dsLNA probes coinciding with increasing TGF-β concentrations. The scale bars are 25 μm. (b) Graph illustrating the fluorescence intensity of the dsLNA probe to miR-21, showing an increase in signal with increasing TGF-β concentrations. (c) Conversely, the fluorescence intensity of the dsLNA probe to miR-23b decreased with increasing TGF-β concentrations. (d) A random, scrambled dsLNA probe fluorescence signal remained stable with increasing TGF-β concentrations. A one-way ANOVA with Tukey’s multiple comparison post-hoc test was performed comparing each dose to the 0 ng/mL TGF-β control (ns, not significant; **, P<0.01; ***, P<0.001). Changes in random probe signal were not significant regardless of comparison with control or comparison between groups.

